Top 5 Team Player Valuations
Data
There is a ton of data in the worldfootballR package; the github for the package is linked here. This particular analysis uses data from transfermarkt. I am going to grab player market values for the top five European leagues.
library(tidyverse); library(here)
library(worldfootballR)
options(scipen=9)
Big_5_player_values <- get_player_market_values(country_name = c("England", "Spain", "France", "Italy", "Germany"), start_year = 2021)
## Warning: Expected 4 pieces. Missing pieces filled with `NA` in 2660 rows [1, 2,
## 3, 4, 5, 6, 7, 8, 9, 10, 11, 12, 13, 14, 15, 16, 17, 18, 19, 20, ...].## Warning in mask$eval_all_mutate(quo): NAs introduced by coercion## Warning: All formats failed to parse. No formats found.save(Big_5_player_values, file=here("content/post/2022-01-28-top-5-team-player-valuations/data","Big5.RData"))A Money Table Function
I want to repeat the same basic plot five times, only selecting a particular league in each iteration. That is a perfect case to write a function and then invoke it for each league. I need a function that only takes one argument, the comp_name that I want to pull out and plot. The competition names will then be the inputs.
Plot.Money.Table <- function(value) {
  Big_5_player_values %>%
    group_by(comp_name, squad) %>%
    summarise(Team.Value = sum(player_market_value_euro, na.rm=TRUE)/100000000) %>%
    ungroup() %>%
    filter(comp_name==value) %>%
    ggplot() +
    aes(x=fct_reorder(squad, Team.Value), y=Team.Value) +
    geom_col() +
    coord_flip() +
    labs(x="Team", y="Total Value of Players in 100M Euros", title=paste0(value, " Money Table", sep=""), caption="Data from transfermarkt")
}
The English Money Table
Plot.Money.Table("Premier League")## `summarise()` has grouped output by 'comp_name'. You can override using the `.groups` argument.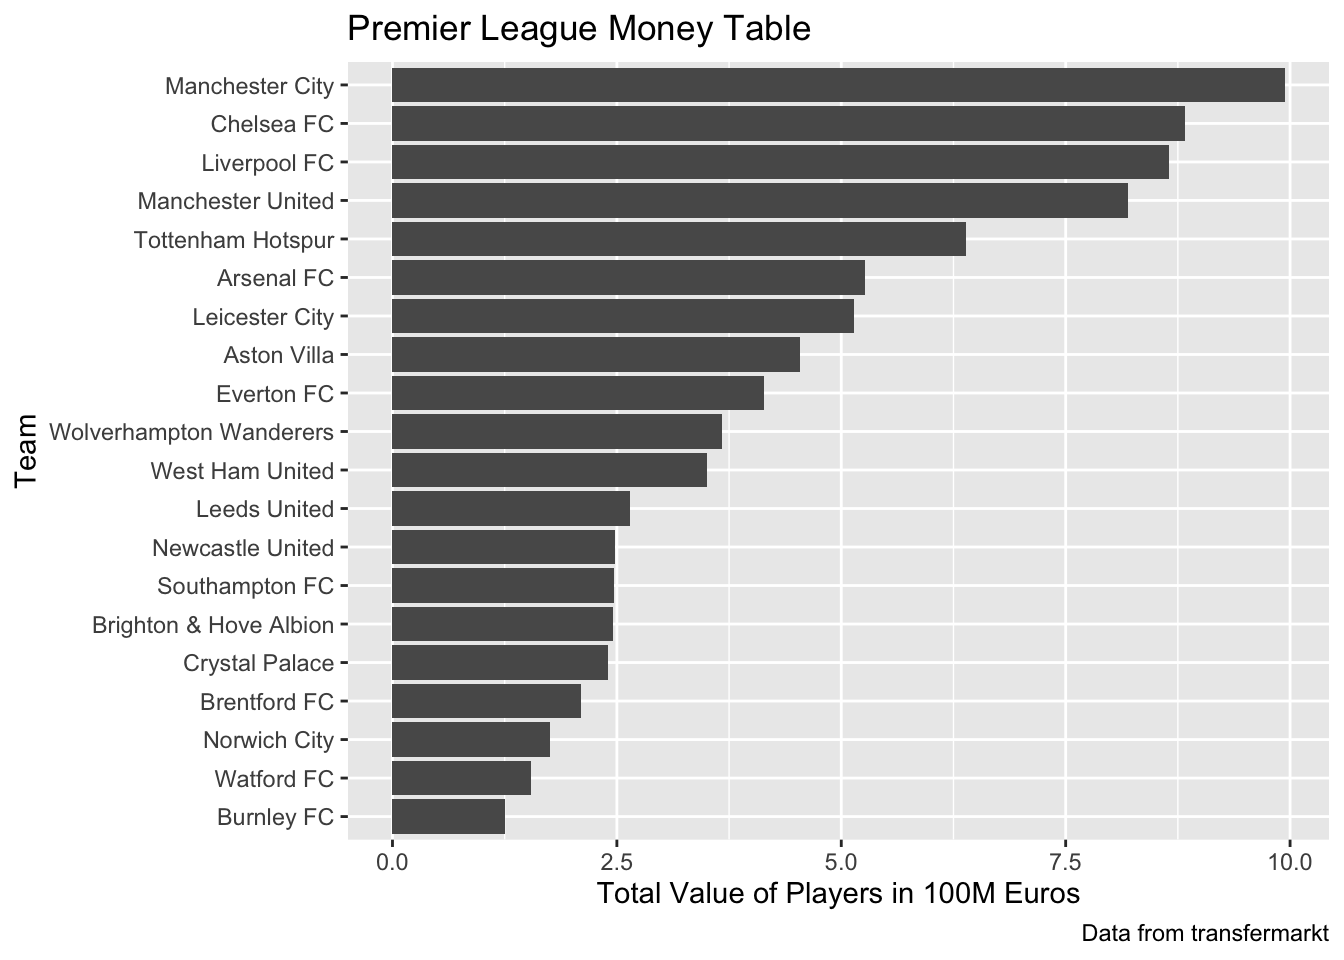
The Spanish Money Table
Plot.Money.Table("LaLiga")## `summarise()` has grouped output by 'comp_name'. You can override using the `.groups` argument.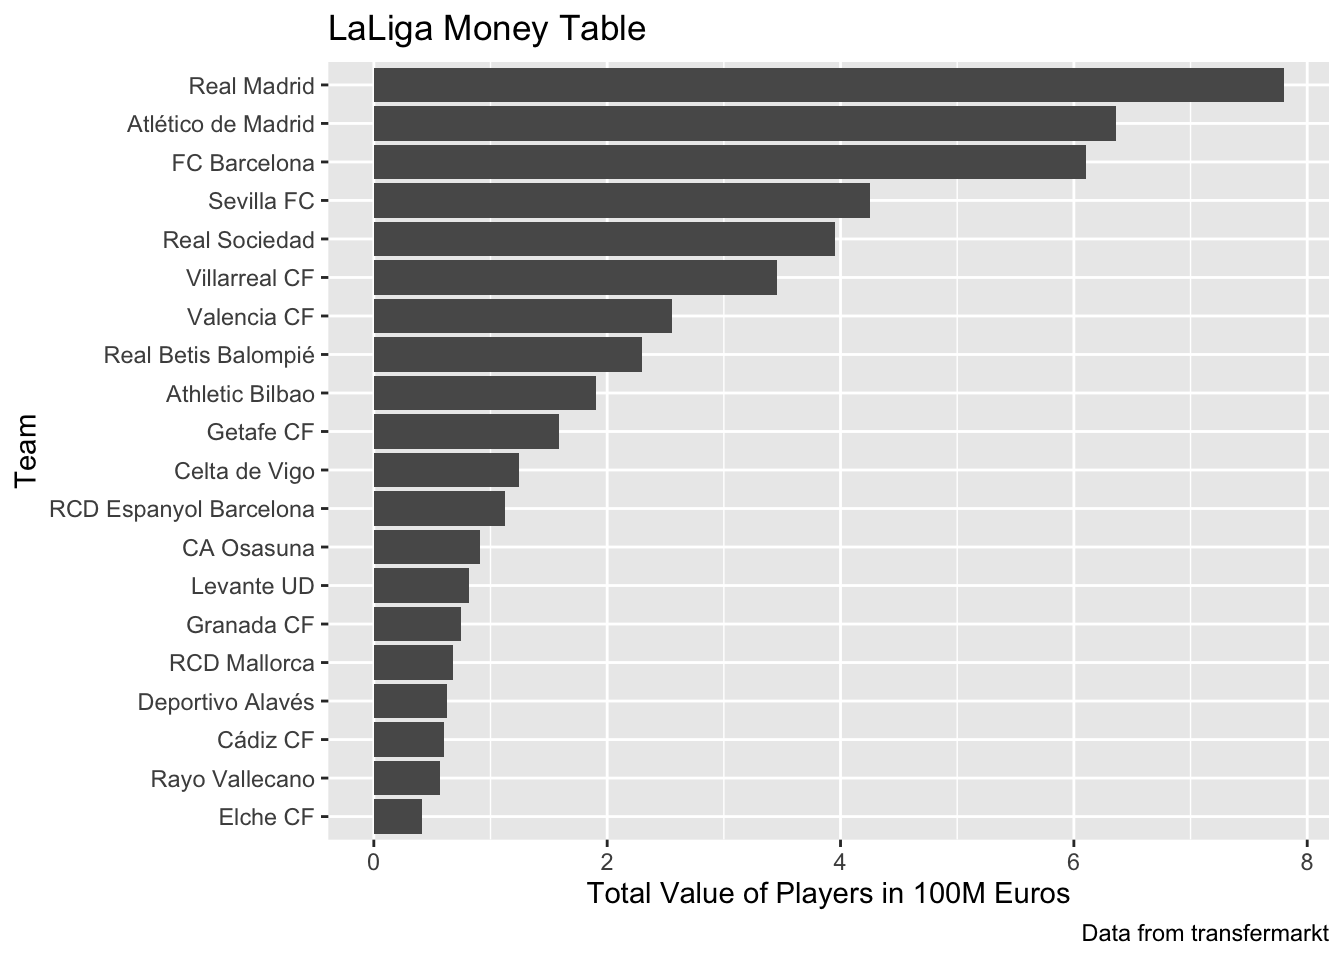
The Italian Money Table
Plot.Money.Table("Serie A")## `summarise()` has grouped output by 'comp_name'. You can override using the `.groups` argument.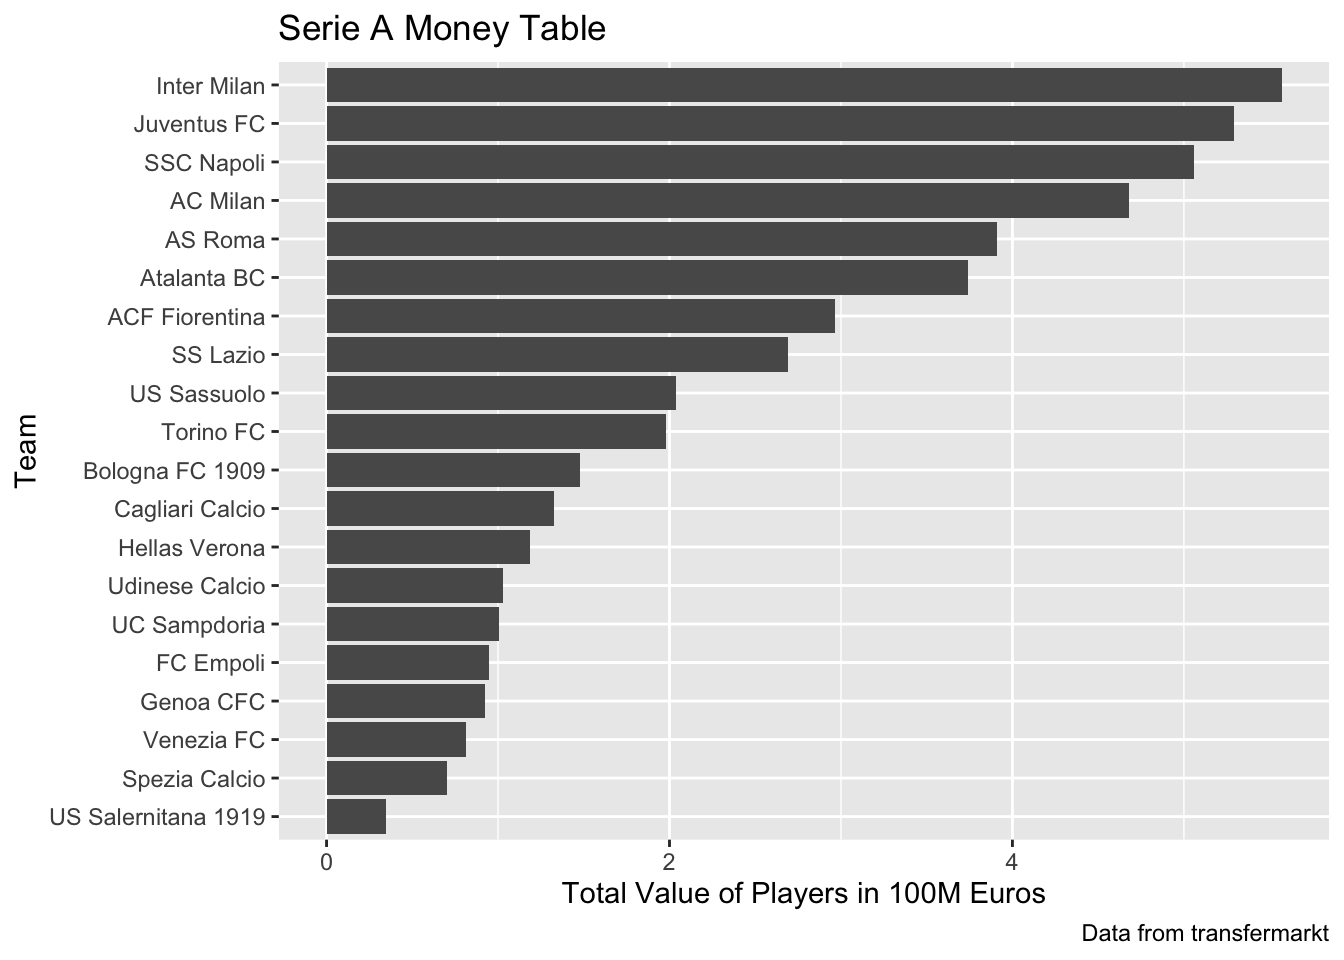
The Germany Money Table
Plot.Money.Table("Bundesliga")## `summarise()` has grouped output by 'comp_name'. You can override using the `.groups` argument.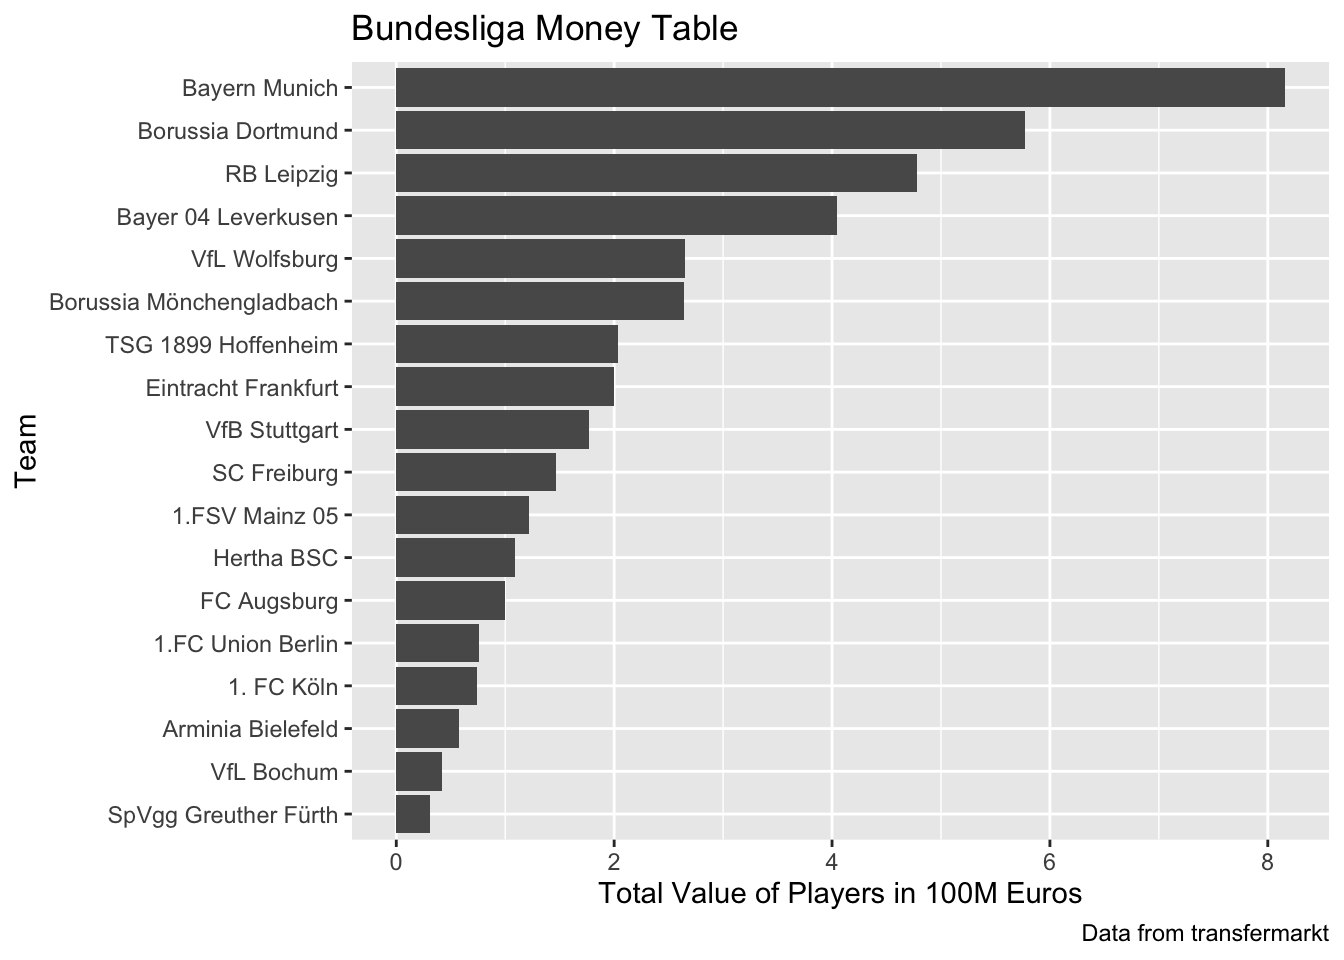
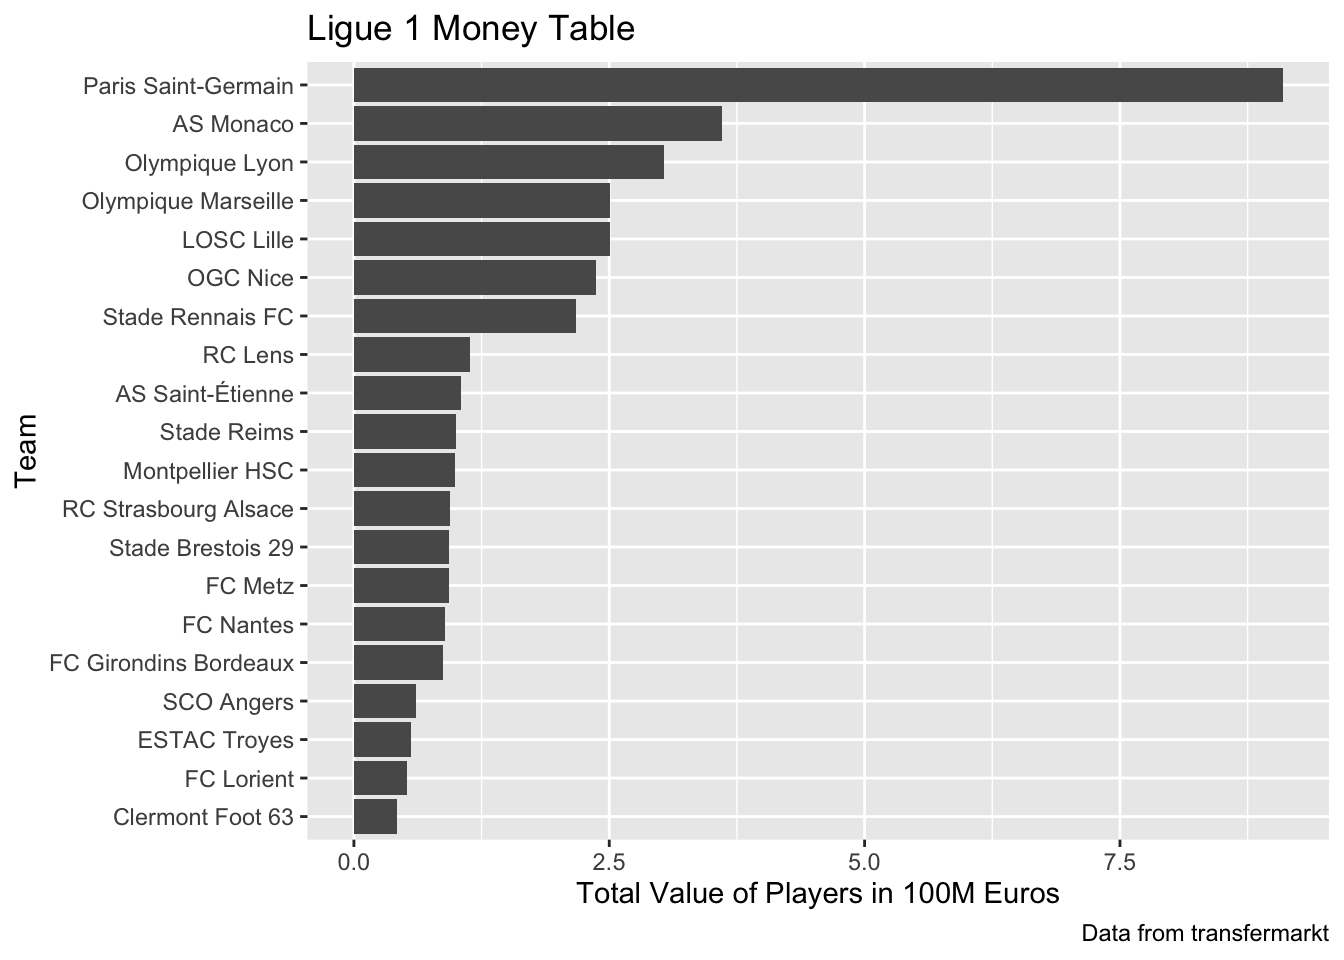
The French Money Table
Plot.Money.Table("Ligue 1")## `summarise()` has grouped output by 'comp_name'. You can override using the `.groups` argument.