A Pigeon Becomes a Barplot
A Pigeon
It really is an amazing pigeon. Apologies that I haven’t a photo credit for it; I found it one day on twitter as it went viral. It is a New York City pigeon.
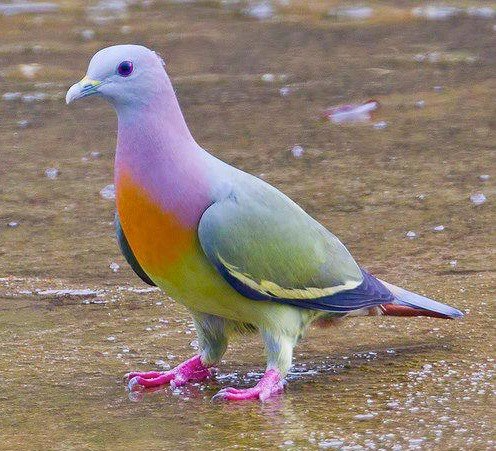
Pigeon
I want to color something with colors from that pigeon. It has an amazing array of colors.
TLDR: Extract colors from pigeon photo to palette. Then use palette in ggplot.
The Palette
First, I have to get the color palette.
R has a package called imgpalr that will extract colors from an image. If I need to, it is install.packages("imgpalr").
In the following code chunk, I will load the package and then I want to point it to the pigeon image that I downloaded. In my case, it is in the same directory as the R Markdown file and is called Pigeon.png.
Inside the command image_pal(), I point it to an image, I specify how many colors [5], what type of color scheme, I want qualitative, and then some characteristics of the colors. The plot will show me the image alongside the palette though it is upside down.
library(imgpalr)
Pigeon.colors <- image_pal("~/Downloads/Pigeon.png", # This will need to be adjusted to the actual file location on your computer.  Mine is in my downloads.
          n = 5, # How many colors?
          type = "qual", # Type of palette?
          saturation = c(0.75, 1),
          brightness = c(0.75, 1),
          plot = TRUE, # Show the image and the palette?
          bw = c(0.7, 0.95)
          )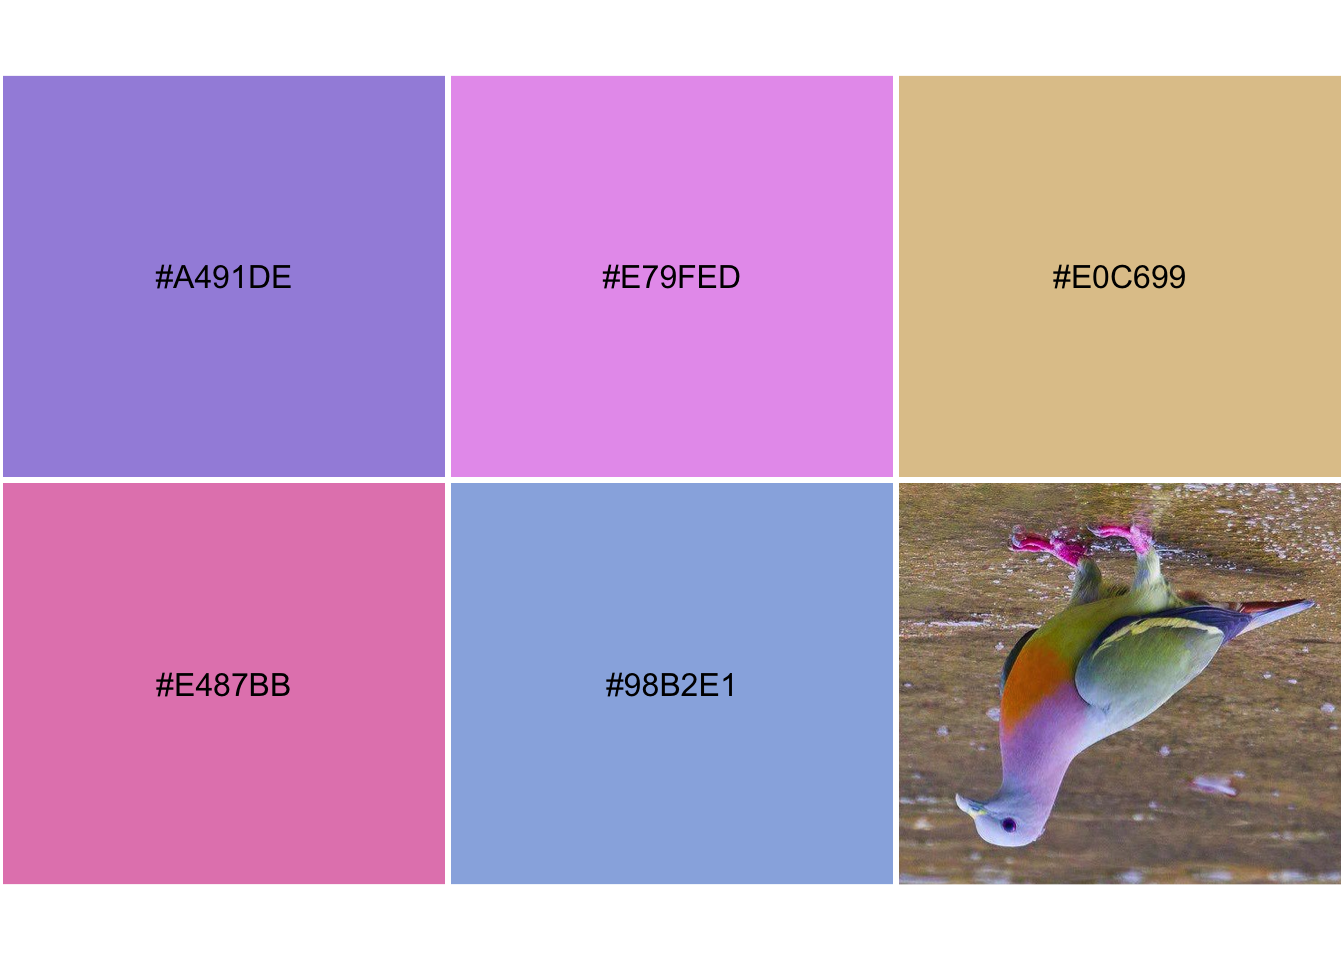
Pigeon.colors## [1] "#A491DE" "#E79FED" "#E0C699" "#E487BB" "#98B2E1"Now I have a palette in the markdown environment called Pigeon.colors. Now I need some data; I want five categories to match my palette. The rest is junk.
Junk.data <- data.frame(Stuff=c("Hi","Howdy","Hello","Hola","Hallo"), vals = runif(5, 0, 1))
Junk.data
## Stuff vals
## 1 Hi 0.9956436
## 2 Howdy 0.8112849
## 3 Hello 0.5295360
## 4 Hola 0.7348846
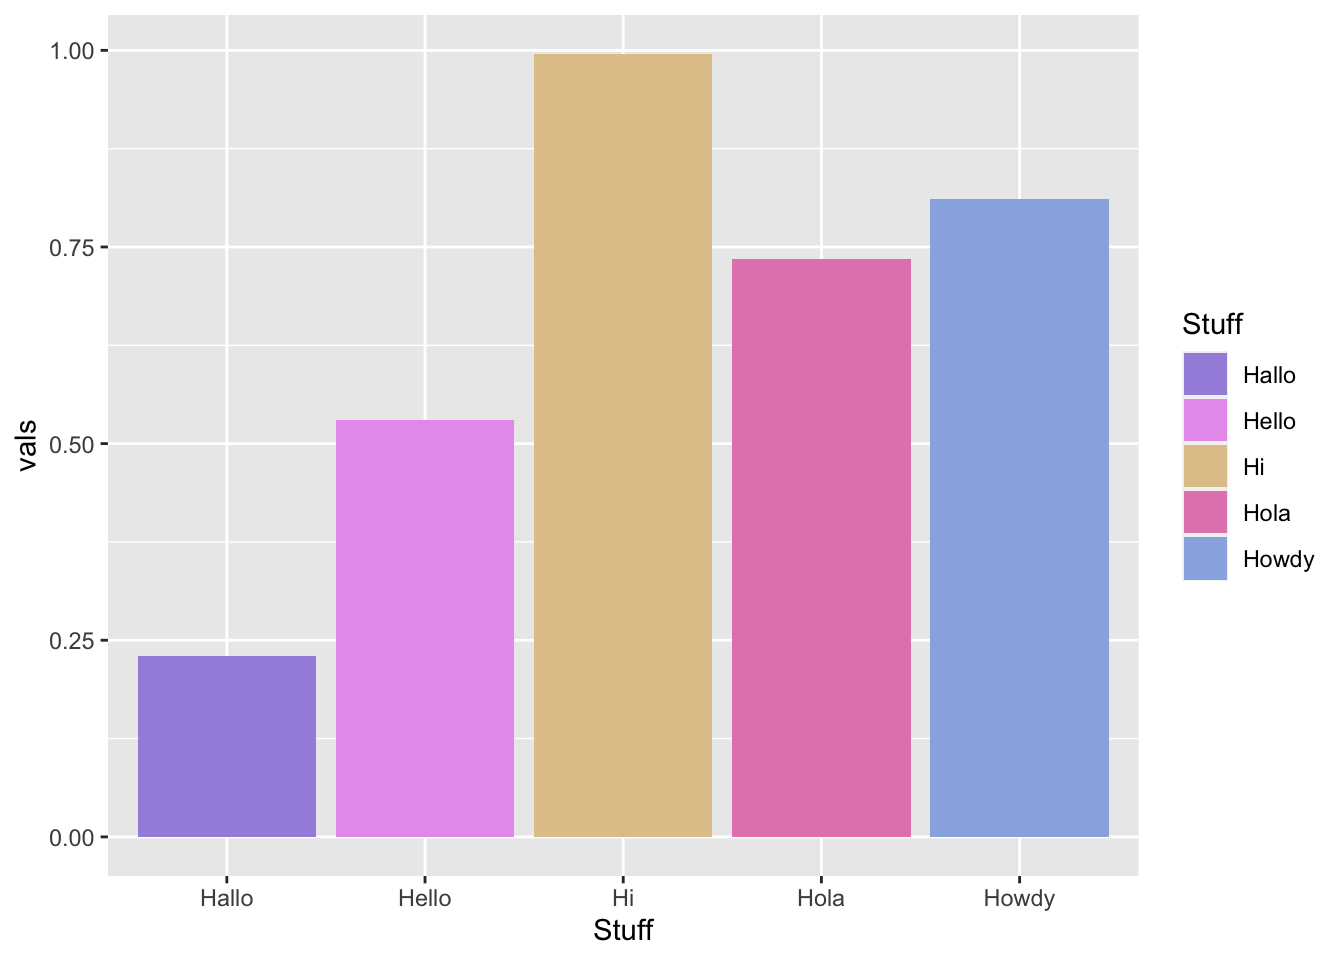
## 5 Hallo 0.2296042I want to graph it using a barplot equivalent because I have the height of the bars in vals. Let me use the fill aesthetic to fill the bars in by the five discrete things stored as Stuff. The trick to using it is to manually specify the colors and point it to the Pigeon.colors above.
library(ggplot2)
ggplot(Junk.data) +
  aes(x=Stuff, y=vals, fill=Stuff) +
  geom_col() +
  scale_fill_manual(values = Pigeon.colors)