Marveling at map()
I want to learn about map and begin to replace my use of apply for everything.
Goal: import a directory full of csv files.
Method. First, load purrr and the tidyverse and then create a tibble for the filenames because we are creating the example. map wants to output a list so I have to unlist it into the tibble.
library(tidyverse)
library(purrr)
# Create a set of filenames
fnames <- tibble(
  filenames=unlist(
  map(c(1:5),
      ~paste0("file",.x,".csv", sep="")
      )))
fnames
## # A tibble: 5 × 1
## filenames
## <chr>
## 1 file1.csv
## 2 file2.csv
## 3 file3.csv
## 4 file4.csv
## 5 file5.csvCreate the files
Now I need to create some files in a given directory. I have created a directory called fakedata.
dir.create("fakedata")Now I want to write the data to the directory to conclude the reproducible example. In this case, there are five csv files.
walk(fnames$filenames,
     ~ write.csv(data.frame(x1=rnorm(10),x2=rnorm(10)),       file = paste0("./fakedata/",.x, sep="")))
That seems to work.
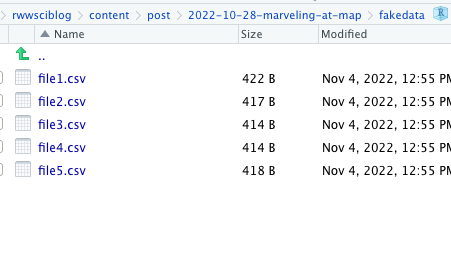
Photo of success
Loading the files
Though I already know the names of the files, in most cases, I would need to collect them. In this particular case, dir() will come in very handy.
dir("fakedata")## [1] "file1.csv" "file2.csv" "file3.csv" "file4.csv" "file5.csv"file.names <- dir("fakedata")Now let’s take those and load the files. We will combine read.csv with map to get a list containing all of the files.
read.files <- file.names %>% map(., ~ read.csv(paste0("fakedata/",.x, sep="")))
read.files
## [[1]]
## X x1 x2
## 1 1 -1.38001285 -1.22636540
## 2 2 0.18200309 -0.47330201
## 3 3 0.38672920 0.32228012
## 4 4 1.59951536 0.17438280
## 5 5 0.04066402 -2.17050573
## 6 6 -0.25814383 0.35882778
## 7 7 -1.09942888 0.05209077
## 8 8 -0.96198031 -0.31535964
## 9 9 -0.71146188 -0.88743843
## 10 10 -0.90768963 -1.64463965
##
## [[2]]
## X x1 x2
## 1 1 -0.93160098 0.38577793
## 2 2 -1.11500843 -2.28599247
## 3 3 0.48695836 -0.38091065
## 4 4 0.43833164 1.94491090
## 5 5 1.38558361 0.29454227
## 6 6 -0.08697636 0.14269709
## 7 7 1.32351741 0.29570675
## 8 8 -0.51831633 -1.07216871
## 9 9 -0.51175809 0.01959317
## 10 10 0.89500573 -1.03716777
##
## [[3]]
## X x1 x2
## 1 1 -0.8834481 -0.25006254
## 2 2 1.0708784 -1.36573365
## 3 3 0.3286340 -0.10929292
## 4 4 1.2088226 -0.04355173
## 5 5 -0.5257318 -0.47974675
## 6 6 3.0484664 -0.32511134
## 7 7 -0.2252273 1.23925377
## 8 8 1.0458161 -1.18513179
## 9 9 0.3243315 1.44062060
## 10 10 0.8238747 -1.53231879
##
## [[4]]
## X x1 x2
## 1 1 0.8460534 0.08150364
## 2 2 -0.3220720 1.07239215
## 3 3 1.3478005 1.18462705
## 4 4 0.9222565 1.16223158
## 5 5 1.1380822 1.05890088
## 6 6 0.6123547 -1.46789361
## 7 7 -0.2974722 -0.37149873
## 8 8 1.0321546 0.15357759
## 9 9 -0.3445316 -0.95253704
## 10 10 -0.1112015 -0.64225964
##
## [[5]]
## X x1 x2
## 1 1 -1.15093999 0.54168693
## 2 2 0.35413293 -0.09396014
## 3 3 -1.26696402 0.25582265
## 4 4 0.06712394 1.23749986
## 5 5 0.53648590 0.37711498
## 6 6 -1.29457309 0.23440024
## 7 7 0.44966760 0.45751493
## 8 8 -0.42755728 0.89952539
## 9 9 -0.06584558 0.09520603
## 10 10 -0.50046918 -0.16258746Let me stick the filenames on the list elements. This allows any individual one to be addressed in a relatively intuitive way. I show an example by calculating the mean of x1 in the third dataset.
clean.files <- read.files
names(clean.files) <- file.names
clean.files
## $file1.csv
## X x1 x2
## 1 1 -1.38001285 -1.22636540
## 2 2 0.18200309 -0.47330201
## 3 3 0.38672920 0.32228012
## 4 4 1.59951536 0.17438280
## 5 5 0.04066402 -2.17050573
## 6 6 -0.25814383 0.35882778
## 7 7 -1.09942888 0.05209077
## 8 8 -0.96198031 -0.31535964
## 9 9 -0.71146188 -0.88743843
## 10 10 -0.90768963 -1.64463965
##
## $file2.csv
## X x1 x2
## 1 1 -0.93160098 0.38577793
## 2 2 -1.11500843 -2.28599247
## 3 3 0.48695836 -0.38091065
## 4 4 0.43833164 1.94491090
## 5 5 1.38558361 0.29454227
## 6 6 -0.08697636 0.14269709
## 7 7 1.32351741 0.29570675
## 8 8 -0.51831633 -1.07216871
## 9 9 -0.51175809 0.01959317
## 10 10 0.89500573 -1.03716777
##
## $file3.csv
## X x1 x2
## 1 1 -0.8834481 -0.25006254
## 2 2 1.0708784 -1.36573365
## 3 3 0.3286340 -0.10929292
## 4 4 1.2088226 -0.04355173
## 5 5 -0.5257318 -0.47974675
## 6 6 3.0484664 -0.32511134
## 7 7 -0.2252273 1.23925377
## 8 8 1.0458161 -1.18513179
## 9 9 0.3243315 1.44062060
## 10 10 0.8238747 -1.53231879
##
## $file4.csv
## X x1 x2
## 1 1 0.8460534 0.08150364
## 2 2 -0.3220720 1.07239215
## 3 3 1.3478005 1.18462705
## 4 4 0.9222565 1.16223158
## 5 5 1.1380822 1.05890088
## 6 6 0.6123547 -1.46789361
## 7 7 -0.2974722 -0.37149873
## 8 8 1.0321546 0.15357759
## 9 9 -0.3445316 -0.95253704
## 10 10 -0.1112015 -0.64225964
##
## $file5.csv
## X x1 x2
## 1 1 -1.15093999 0.54168693
## 2 2 0.35413293 -0.09396014
## 3 3 -1.26696402 0.25582265
## 4 4 0.06712394 1.23749986
## 5 5 0.53648590 0.37711498
## 6 6 -1.29457309 0.23440024
## 7 7 0.44966760 0.45751493
## 8 8 -0.42755728 0.89952539
## 9 9 -0.06584558 0.09520603
## 10 10 -0.50046918 -0.16258746clean.files$file3.csv %>% summarise(mean(x1))## mean(x1)
## 1 0.6216417mean(read.files[[3]]$x1)## [1] 0.6216417If every spreadsheet happened to be the same, as these are, then we could also stack them. There is a danger to the renaming because of the way it works with unlist. Sticking with the original file, they are straightforward to stack using map_dfr()
stacked.files <- file.names %>% map_dfr(., ~ read.csv(paste0("fakedata/",.x, sep="")))
stacked.files
## X x1 x2
## 1 1 -1.38001285 -1.22636540
## 2 2 0.18200309 -0.47330201
## 3 3 0.38672920 0.32228012
## 4 4 1.59951536 0.17438280
## 5 5 0.04066402 -2.17050573
## 6 6 -0.25814383 0.35882778
## 7 7 -1.09942888 0.05209077
## 8 8 -0.96198031 -0.31535964
## 9 9 -0.71146188 -0.88743843
## 10 10 -0.90768963 -1.64463965
## 11 1 -0.93160098 0.38577793
## 12 2 -1.11500843 -2.28599247
## 13 3 0.48695836 -0.38091065
## 14 4 0.43833164 1.94491090
## 15 5 1.38558361 0.29454227
## 16 6 -0.08697636 0.14269709
## 17 7 1.32351741 0.29570675
## 18 8 -0.51831633 -1.07216871
## 19 9 -0.51175809 0.01959317
## 20 10 0.89500573 -1.03716777
## 21 1 -0.88344806 -0.25006254
## 22 2 1.07087838 -1.36573365
## 23 3 0.32863403 -0.10929292
## 24 4 1.20882258 -0.04355173
## 25 5 -0.52573184 -0.47974675
## 26 6 3.04846641 -0.32511134
## 27 7 -0.22522727 1.23925377
## 28 8 1.04581612 -1.18513179
## 29 9 0.32433151 1.44062060
## 30 10 0.82387468 -1.53231879
## 31 1 0.84605339 0.08150364
## 32 2 -0.32207204 1.07239215
## 33 3 1.34780048 1.18462705
## 34 4 0.92225652 1.16223158
## 35 5 1.13808219 1.05890088
## 36 6 0.61235469 -1.46789361
## 37 7 -0.29747222 -0.37149873
## 38 8 1.03215455 0.15357759
## 39 9 -0.34453156 -0.95253704
## 40 10 -0.11120152 -0.64225964
## 41 1 -1.15093999 0.54168693
## 42 2 0.35413293 -0.09396014
## 43 3 -1.26696402 0.25582265
## 44 4 0.06712394 1.23749986
## 45 5 0.53648590 0.37711498
## 46 6 -1.29457309 0.23440024
## 47 7 0.44966760 0.45751493
## 48 8 -0.42755728 0.89952539
## 49 9 -0.06584558 0.09520603
## 50 10 -0.50046918 -0.16258746