Analyzing the Trump Campaign's Solicitations
tl;dr
In September of 2018, I began to track email solicitations by the Trump Campaign. I have noticed a striking pattern of increasing fundraising activity that started just after the July 4 weekend but I wanted to verify this over the span of the data. In short, something is up.
The Data
I will use the wonderful gmailr package to access my gmail. You need a key and an id that the vignette gives guidance on. I invoke those elsewhere to keep the tokens safe. First, let me grab all the solicitations; I identify them by the domain in from rnchq.com.
my.messages <- gm_messages("rnchq.com", 1500)
get_emails <- function(message_ids) {
results <- list()
for (message_id in message_ids) {
results[[message_id]] <- gm_message(message_id)
}
return(results)
}
get_message_ids <- function(gmailr_obj) {
message_ids <- character()
for (elem in gmailr_obj) {
messages <- elem[['messages']]
for (i in seq_along(messages)) {
message_ids <- append(message_ids, messages[[i]][['id']])
}
}
return(message_ids)
}
message_ids <- get_message_ids(my.messages)
# message_ids
my.Trump.mails <- get_emails(message_ids)
I now have a list with identifiers for each of the messages that they have sent. Now I want to extract a few features from them to analyze: date sent and by whom. This was amazingly simple to do because I ran across a blog entry that asked similar data questions on embracing the random.
What Date?
get_email_date <- function(email_obj) {
headers <- as.data.table(do.call(rbind, email_obj$payload$headers))
email_date <- headers[name=='Date', value][[1]]
return(email_date)
}
library(data.table)
library(stringr)
create_date_features <- function(email_date_dt) {
  email_date_dt[, `:=`(
    email_date = date(email_date_posix),
    email_day = day(email_date_posix),
    email_month = month(email_date_posix),
    email_year = year(email_date_posix),
    email_weekday = wday(email_date_posix),
    email_hour = hour(email_date_posix),
    email_minute = minute(email_date_posix),
    email_second = second(email_date_posix)
  )]
  return(email_date_dt)
}
make_email_dates_dt <- function(emails_list) {
result <- data.table()
for (email in emails_list) {
email_id <- email$id
# deal with our email header `Date`
email_date <- get_email_date(email)
email_date_posix <- convert_email_date(email_date)
# create our intermediate results
temp_result <- data.table(email_id=email_id, email_date=email_date,
email_date_posix=email_date_posix)
result <- rbind(result, temp_result)
}
result <- create_date_features(result)
return(result)
}
convert_email_date <- function(email_date_str) {
email_date_posix <- as_datetime(email_date_str, format='%a, %d %b %Y %H:%M:%S %z')
return(as.POSIXct(email_date_posix))
}
library(lubridate); library(hrbrthemes)
Trump.dates <- make_email_dates_dt(my.Trump.mails)
# Trump.dates
Trump.dates %>% group_by(email_date) %>% summarise(Count = n()) -> Trump.dates.Counted
Trump.dates.Counted %>% filter(email_date <= Sys.Date()) %>% ggplot(., aes(x=email_date, y=Count)) + geom_line(color="red") + geom_vline(aes(xintercept=as.Date("2020-11-03")), color="blue", alpha=0.3) + labs(title="Trump Fundraising Emails", x="Date of Email", y="Solicitations") + theme_ipsum_rc() -> p1
p1 + geom_text(data = data.frame(x = as.Date("2020-11-02"),
y = 2.87691946455173,
label = "Election"),
mapping = aes(x = x,
y = y,
label = label),
size = 3.86605783866058,
angle = 0L,
lineheight = 1L,
hjust = 0.5,
vjust = 0.5,
colour = "blue",
family = "sans",
fontface = "plain",
inherit.aes = FALSE,
show.legend = FALSE)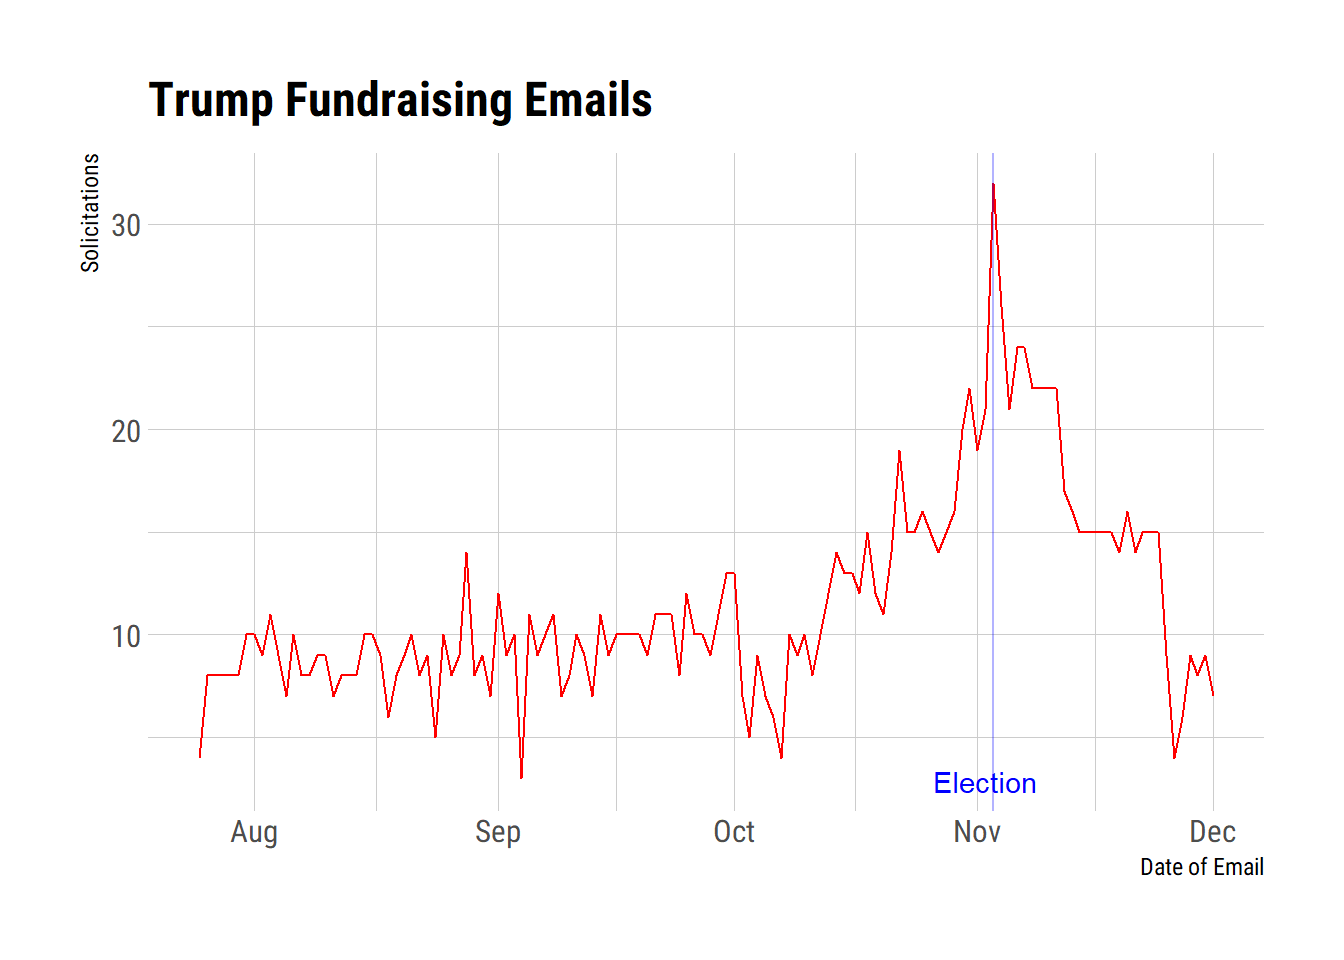
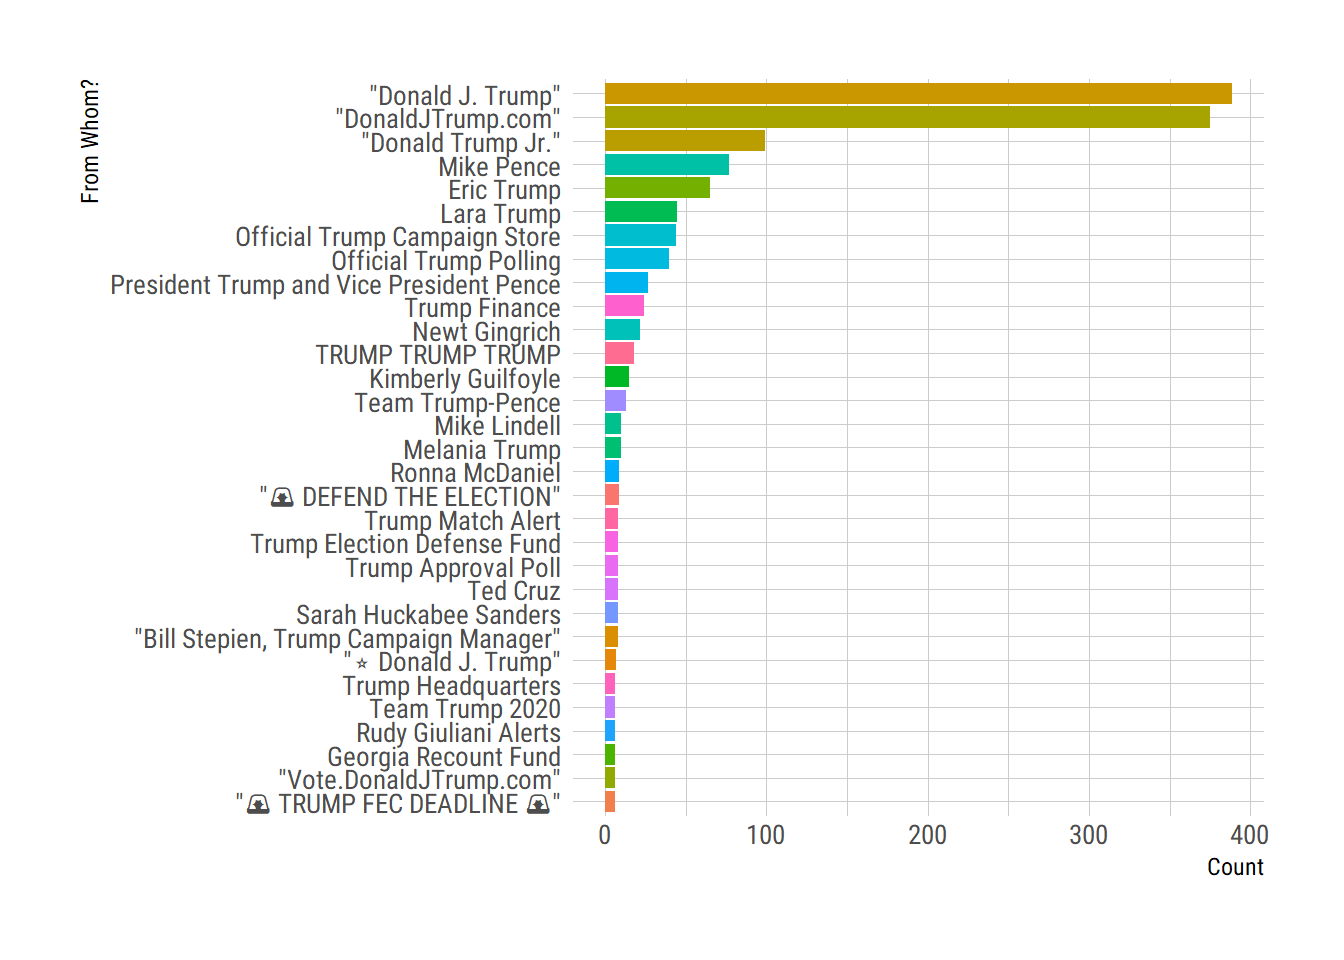
Sent by Whom?
I guess this answers the question of sibling rivalry. Eric and Lara are clearly the favorites. Poor Don Jr. is just ahead of the campaign store, Newt Gingrich, and Brad Parscale [fired yesterday].
get_email_from <- function(email_obj) {
headers <- as.data.table(do.call(rbind, email_obj$payload$headers))
email_date <- headers[name=='From', value][[1]]
return(email_date)
}
make_email_from_dt <- function(emails_list) {
result <- data.table()
for (email in emails_list) {
email_id <- email$id
# deal with our email header `Date`
email_from <- get_email_from(email)
# create our intermediate results
temp_result <- data.table(email_id=email_id, email_from=email_from)
result <- rbind(result, temp_result)
}
return(result)
}
Trump.from <- make_email_from_dt(my.Trump.mails)
Trump.from %>% mutate(email_From = str_remove(email_from, "<contact@victory.donaldtrump.com>")) %>% mutate(email_From = str_remove(email_From, "<contact@campaigns.rnchq.com>")) %>% mutate(email_From = str_remove(email_From, "<info@team.gop.com>")) %>% mutate(email_From = str_remove(email_From, "<contact@team.donaldtrump.com>")) %>% group_by(email_From) %>% summarise(Count = n()) %>%
  filter(Count > 5) %>%
  ggplot(., aes(x=fct_reorder(email_From, Count), y=Count, fill=email_From)) + geom_col() + coord_flip() + guides(fill=FALSE) + labs(x="From Whom?") + theme_ipsum_rc(base_size = 10)
## `summarise()` ungrouping output (override with `.groups` argument)