Correlation Function
Correlations and the Impact on Sums and Differences
I will use a simple R function to illustrate the effect of correlation on sums and differences of random variables. In general, the variance [and standard deviation] of a sum of random variables is the variance of the individual variables plus twice the covariance; the variance [and standard deviation] of a difference in random variables is the variance of the individual variables minus twice the (signed) covariance.
\[ Var (\sum_{i=1}^{n} X_{i}) = \sum_{i=1}^{n} Var(X_{i}) + 2 \sum_{1 \leq i \leq j \leq n} Cov(X_{i},X_{j}) \]
Now for the function and two examples.
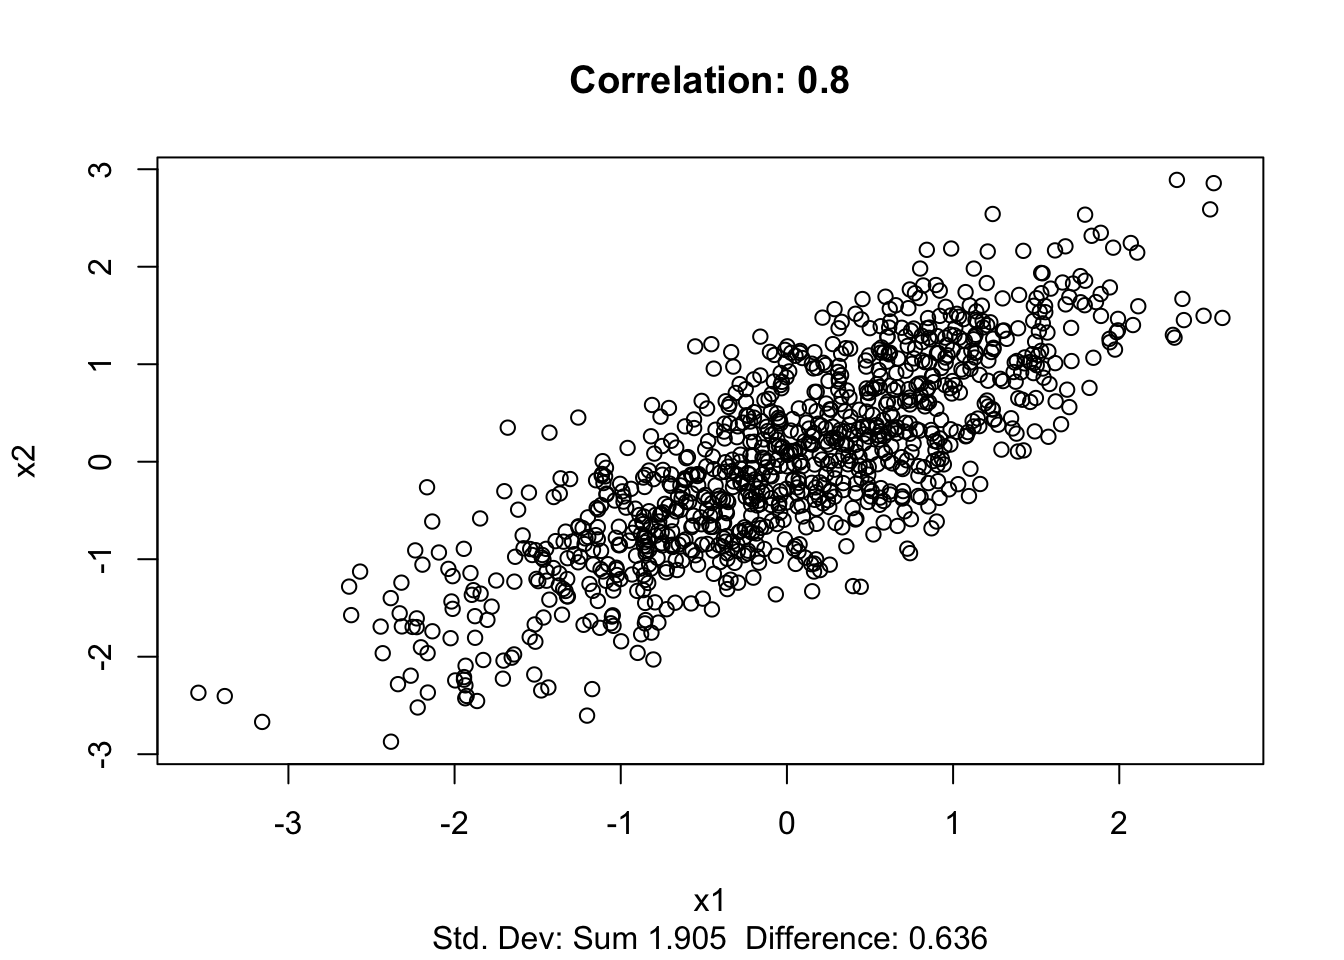
Correlation is 0.8
library(MASS)
plot.cor <- function(cor) {
  if(-1 < cor & cor < 1) {
mean.vec <- c(0,0)
sig.mat <- matrix(c(1,cor,cor,1), nrow=2)
df <- data.frame(mvrnorm(n=1000, mean.vec, sig.mat))
df$sum <- rowSums(df)
df$diff <- with(df, X1-X2)
plot(x=df$X1, y=df$X2, xlab="x1", ylab="x2", main=paste("Correlation:",cor), sub=paste("Std. Dev: Sum",round(sd(df$sum), digits=3)," Difference:",round(sd(df$diff), digits=3)))
  }
  else { cat("Correlation must be between -1 and 1") }
}
plot.cor(cor=0.8)
The correlation above is 0.8
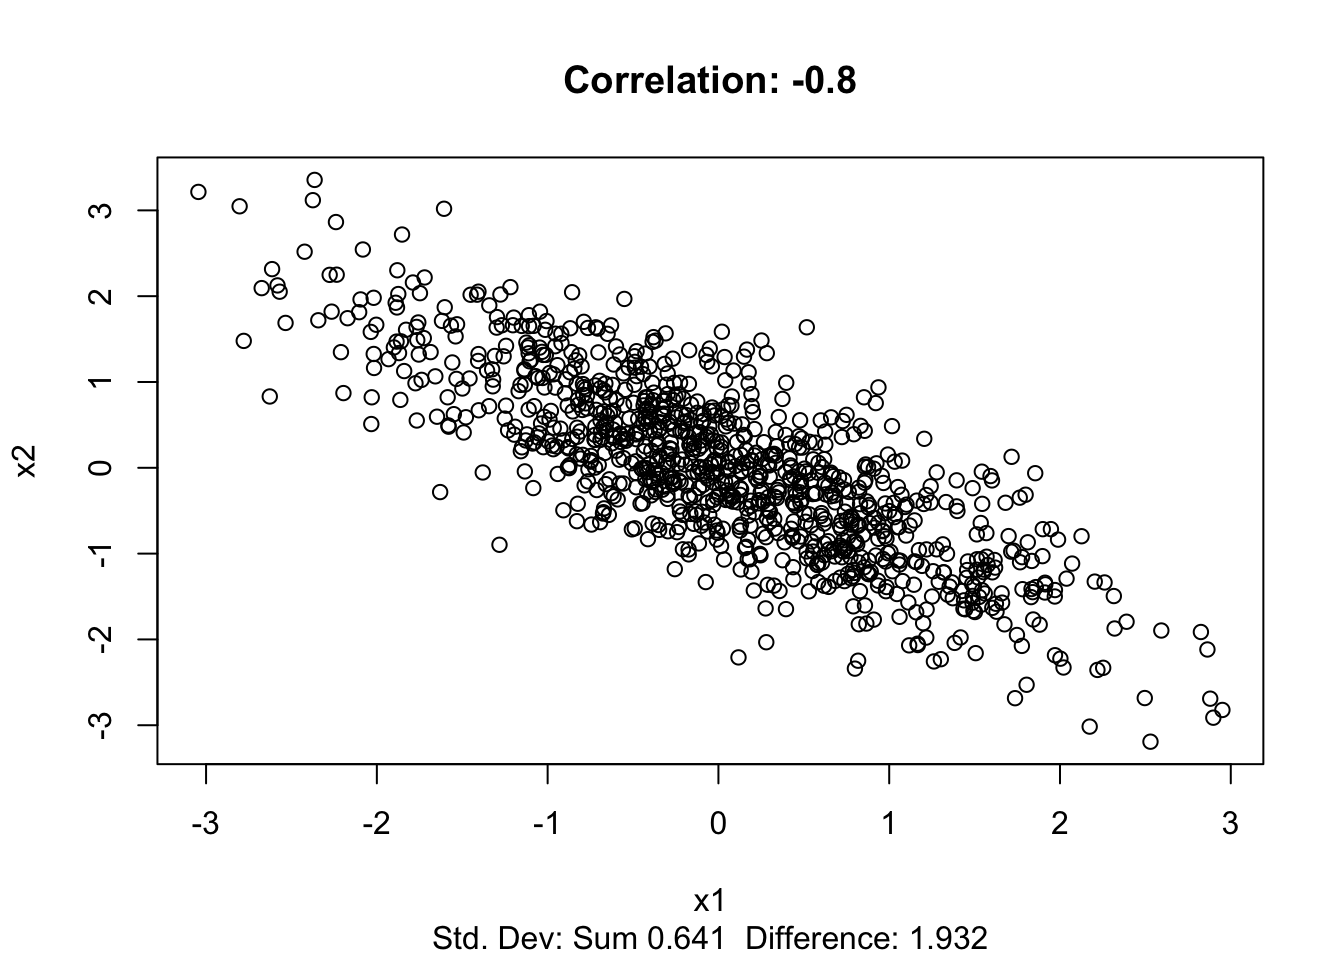
Correlation is -0.8
plot.cor(cor=-0.8)