Inflation Expectations
The Federal Reserve Bank of New York provides interesting data on inflation expectations. I was first interested in this because it appears as though the survey respondents have consistently overestimated inflation expectations over the last few years. But now, in a time of heightened concern about inflation, it is worthwhile to revisit the data.
library(tidyverse)
library(lubridate); library(tsibble)
library(readxl); library(magrittr)
library(kableExtra)
url <- "https://www.newyorkfed.org/medialibrary/interactives/sce/sce/downloads/data/frbny-sce-data.xlsx"
destfile <- "frbny_sce_data.xlsx"
curl::curl_download(url, destfile)
Inflation.Expectations <- read_excel(destfile, sheet=4, skip=3)
Inflation.Expectations %>%
  kable() %>%
  kable_styling() %>%
scroll_box(width = "100%", height = "500px")| …1 | Median one-year ahead expected inflation rate | Median three-year ahead expected inflation rate | 25th Percentile one-year ahead expected inflation rate | 25th Percentile three-year ahead expected inflation rate | 75th Percentile one-year ahead expected inflation rate | 75th Percentile three-year ahead expected inflation rate | Median point prediction one-year ahead inflation rate | Median point prediction three-year ahead inflation rate |
|---|---|---|---|---|---|---|---|---|
| 201306 | 3.090884 | 3.416846 | 1.9766899 | 1.9509043 | 5.944291 | 6.000000 | 4.569018 | 4.735714 |
| 201307 | 3.162522 | 3.310545 | 1.6002527 | 1.5759639 | 6.000000 | 6.330960 | 4.682268 | 4.893152 |
| 201308 | 3.395071 | 3.799491 | 2.0000000 | 1.6044991 | 7.192735 | 7.192735 | 4.800452 | 5.040974 |
| 201309 | 3.367290 | 3.546918 | 1.9176887 | 1.7006738 | 6.874382 | 7.027530 | 4.754334 | 4.878838 |
| 201310 | 3.174733 | 3.196597 | 1.6670417 | 1.6044991 | 6.414917 | 6.558024 | 4.619435 | 4.875060 |
| 201311 | 3.196597 | 3.314703 | 1.6856116 | 1.7418048 | 6.232919 | 6.754294 | 4.087263 | 4.684939 |
| 201312 | 3.137840 | 3.299735 | 1.6044991 | 1.5653559 | 6.026756 | 6.357209 | 4.518580 | 4.648178 |
| 201401 | 3.000000 | 3.046670 | 1.4001945 | 1.2561138 | 6.061110 | 6.025575 | 4.123138 | 4.110649 |
| 201402 | 3.090884 | 3.177027 | 1.7688211 | 1.5469180 | 6.000000 | 6.035755 | 4.131488 | 4.079364 |
| 201403 | 3.196597 | 3.377147 | 1.5469180 | 1.5469180 | 6.097920 | 6.223626 | 4.521639 | 4.651865 |
| 201404 | 3.303940 | 3.204834 | 1.7923245 | 1.6874917 | 6.303314 | 6.235626 | 4.473255 | 4.317511 |
| 201405 | 3.171748 | 3.196597 | 1.6044991 | 1.5469180 | 6.000000 | 6.486081 | 4.342987 | 4.525708 |
| 201406 | 3.204563 | 3.297345 | 1.7576319 | 1.5000967 | 6.000000 | 6.414917 | 4.752476 | 4.599026 |
| 201407 | 3.111111 | 3.218860 | 1.6995459 | 1.6775503 | 6.366208 | 6.510431 | 4.539547 | 4.516861 |
| 201408 | 3.000000 | 3.085294 | 1.5752116 | 1.6321160 | 6.000000 | 6.000000 | 4.039658 | 4.273867 |
| 201409 | 3.000000 | 3.015459 | 1.5734774 | 1.4624749 | 6.000000 | 6.339693 | 3.873158 | 4.153529 |
| 201410 | 3.000000 | 3.015459 | 1.4624749 | 1.3130764 | 6.000000 | 6.000000 | 3.458891 | 3.997284 |
| 201411 | 3.015459 | 3.034222 | 1.4624749 | 1.3726228 | 6.000000 | 6.000000 | 3.608507 | 4.091155 |
| 201412 | 2.980844 | 3.000000 | 1.0000000 | 1.1738002 | 5.650182 | 5.869063 | 3.084015 | 4.022125 |
| 201501 | 2.926264 | 3.000000 | 1.1019423 | 1.2069269 | 5.423985 | 5.985323 | 3.315294 | 4.147226 |
| 201502 | 2.830265 | 3.000000 | 1.1975554 | 1.1976033 | 5.162554 | 5.904663 | 3.180199 | 4.131799 |
| 201503 | 2.875452 | 2.915113 | 1.0760911 | 1.0156784 | 4.950111 | 5.487096 | 3.120108 | 3.616236 |
| 201504 | 2.733259 | 2.980844 | 1.0000000 | 1.0000000 | 4.997518 | 5.643198 | 3.157371 | 3.888054 |
| 201505 | 2.955763 | 2.980844 | 1.2880070 | 1.2215939 | 4.906164 | 5.337633 | 3.257119 | 3.802553 |
| 201506 | 3.000000 | 3.000000 | 1.4025799 | 1.2880070 | 5.760430 | 5.593090 | 3.469145 | 3.786062 |
| 201507 | 2.955357 | 2.955680 | 1.2880070 | 1.1221224 | 5.734184 | 5.570208 | 3.182219 | 3.741563 |
| 201508 | 2.793575 | 2.867507 | 1.0000000 | 1.1019423 | 5.191454 | 5.530786 | 3.065382 | 3.714436 |
| 201509 | 2.734659 | 2.842578 | 1.0432696 | 1.0000000 | 4.708744 | 5.423985 | 3.158668 | 3.259574 |
| 201510 | 2.823326 | 2.781905 | 1.0252963 | 1.0000000 | 5.190876 | 5.165283 | 3.063085 | 3.153144 |
| 201511 | 2.554007 | 2.681402 | 1.0000000 | 1.0000000 | 4.733266 | 5.045190 | 3.049218 | 3.144082 |
| 201512 | 2.537525 | 2.775065 | 1.0000000 | 1.0000000 | 4.730198 | 5.075049 | 3.097423 | 3.130671 |
| 201601 | 2.417507 | 2.453082 | 1.0000000 | 0.8968862 | 4.712423 | 4.590201 | 2.954850 | 3.043420 |
| 201602 | 2.711993 | 2.622853 | 1.0000000 | 1.0000000 | 5.143975 | 5.054150 | 3.107146 | 3.387503 |
| 201603 | 2.530770 | 2.500490 | 1.0000000 | 1.0000000 | 4.488211 | 4.708021 | 3.089970 | 3.104698 |
| 201604 | 2.613696 | 2.791493 | 1.0621943 | 1.0000000 | 5.084910 | 5.487096 | 3.089232 | 3.153507 |
| 201605 | 2.622853 | 2.734135 | 1.0000000 | 1.0000000 | 4.997918 | 5.240709 | 3.144871 | 3.097219 |
| 201606 | 2.537871 | 2.861800 | 1.0000000 | 1.0000000 | 4.894264 | 5.309123 | 3.144044 | 3.652668 |
| 201607 | 2.521351 | 2.501432 | 1.0000000 | 1.0000000 | 5.083651 | 5.272973 | 3.231861 | 3.443616 |
| 201608 | 2.793575 | 2.711993 | 1.0000000 | 0.9995852 | 5.283558 | 5.559269 | 3.098649 | 3.424709 |
| 201609 | 2.495162 | 2.623311 | 1.0000000 | 1.0000000 | 4.812058 | 5.242156 | 3.044933 | 3.551025 |
| 201610 | 2.588671 | 2.582562 | 1.0000000 | 1.0000000 | 5.111414 | 5.501368 | 3.075901 | 3.217843 |
| 201611 | 2.537525 | 2.711993 | 1.0000000 | 0.9995852 | 4.747997 | 5.337633 | 3.114850 | 3.099744 |
| 201612 | 2.812191 | 2.831908 | 1.0000000 | 1.0000000 | 5.191454 | 5.576227 | 3.171784 | 3.822607 |
| 201701 | 2.980844 | 2.895548 | 1.0000000 | 1.0000000 | 5.075049 | 5.552731 | 3.131943 | 3.819542 |
| 201702 | 2.961960 | 2.980844 | 1.0000000 | 1.0000000 | 5.309342 | 5.640829 | 3.134774 | 3.688152 |
| 201703 | 2.736074 | 2.711993 | 1.0000000 | 1.0000000 | 4.707835 | 5.423985 | 3.099358 | 3.099730 |
| 201704 | 2.793575 | 2.908013 | 1.0110189 | 1.0000000 | 4.852659 | 5.600195 | 3.028089 | 3.177438 |
| 201705 | 2.588671 | 2.467132 | 1.0000000 | 0.9603176 | 4.416696 | 5.084910 | 3.070494 | 3.077746 |
| 201706 | 2.538351 | 2.775065 | 1.0000000 | 1.0000000 | 4.000000 | 4.830334 | 2.993377 | 3.499542 |
| 201707 | 2.537525 | 2.711993 | 1.0000000 | 1.0000000 | 4.143766 | 4.912187 | 3.001880 | 3.177373 |
| 201708 | 2.490645 | 2.623311 | 1.0262393 | 1.0000000 | 4.000000 | 4.636709 | 2.964123 | 3.033085 |
| 201709 | 2.537525 | 2.804799 | 1.0760593 | 1.0000000 | 4.353259 | 4.955311 | 3.002994 | 3.101659 |
| 201710 | 2.613696 | 2.812191 | 1.0275226 | 1.0000000 | 4.734380 | 4.906164 | 3.021131 | 3.035650 |
| 201711 | 2.606111 | 2.775065 | 1.0000000 | 1.0000000 | 4.076428 | 5.123124 | 3.015359 | 3.354707 |
| 201712 | 2.824348 | 2.894165 | 1.0139530 | 1.0489619 | 4.812058 | 5.423985 | 3.090315 | 3.383863 |
| 201801 | 2.711993 | 2.793575 | 1.2215939 | 1.0000000 | 4.611607 | 4.955596 | 3.042407 | 3.354264 |
| 201802 | 2.831908 | 2.884280 | 1.2880070 | 1.0760911 | 4.000004 | 4.753406 | 3.019136 | 3.139175 |
| 201803 | 2.752288 | 2.908013 | 1.2612020 | 1.0000000 | 4.000000 | 4.732663 | 3.064530 | 3.133537 |
| 201804 | 2.980844 | 2.969947 | 1.3182645 | 1.0141683 | 4.752013 | 5.075049 | 3.055087 | 3.526599 |
| 201805 | 2.980844 | 2.961960 | 1.2880070 | 1.0000000 | 5.272973 | 5.075049 | 3.065584 | 3.610773 |
| 201806 | 2.980844 | 3.000000 | 1.2879126 | 1.0968928 | 5.195765 | 5.433788 | 3.061135 | 3.801067 |
| 201807 | 2.982717 | 2.883912 | 1.1878090 | 1.0497167 | 4.917837 | 5.207691 | 3.094729 | 3.711997 |
| 201808 | 3.000000 | 3.000000 | 1.2786471 | 1.0000000 | 5.075049 | 5.162554 | 3.068000 | 3.196795 |
| 201809 | 2.995079 | 3.000000 | 1.3001620 | 1.0000000 | 5.022497 | 5.323853 | 3.113970 | 3.087066 |
| 201810 | 3.000000 | 3.000000 | 1.2880070 | 1.1975554 | 5.075049 | 5.272973 | 3.036429 | 3.465295 |
| 201811 | 2.969947 | 2.883912 | 1.1878090 | 1.0000000 | 5.075049 | 5.000339 | 3.056169 | 3.058216 |
| 201812 | 3.000000 | 2.980844 | 1.3542874 | 1.2046406 | 5.098937 | 5.000339 | 3.033847 | 3.076178 |
| 201901 | 2.969947 | 2.969947 | 1.2880070 | 1.1906530 | 5.143975 | 5.306211 | 3.060074 | 3.143794 |
| 201902 | 2.793575 | 2.768439 | 1.1976033 | 1.0572500 | 4.381966 | 4.700791 | 3.014273 | 3.045013 |
| 201903 | 2.816437 | 2.864411 | 1.2880070 | 1.0133870 | 4.583594 | 4.450937 | 3.002415 | 3.080776 |
| 201904 | 2.598124 | 2.693518 | 1.1111110 | 1.0000000 | 4.035463 | 4.546977 | 3.009228 | 3.039631 |
| 201905 | 2.453082 | 2.593332 | 1.0304210 | 1.0000000 | 3.999662 | 4.583594 | 2.987517 | 3.028864 |
| 201906 | 2.670152 | 2.662437 | 1.0365318 | 1.0000000 | 4.872115 | 4.891215 | 3.029801 | 3.081023 |
| 201907 | 2.590599 | 2.579366 | 1.0031077 | 1.0000000 | 4.534411 | 4.937747 | 2.939522 | 3.022346 |
| 201908 | 2.414449 | 2.501432 | 1.0000000 | 1.0000000 | 4.374343 | 4.828501 | 2.912732 | 2.983591 |
| 201909 | 2.483634 | 2.374794 | 1.0000000 | 0.7932609 | 4.140936 | 4.320539 | 2.968139 | 3.005824 |
| 201910 | 2.330186 | 2.378875 | 1.0000000 | 1.0000000 | 3.819017 | 4.450937 | 2.975578 | 3.019154 |
| 201911 | 2.347553 | 2.521351 | 1.0000000 | 1.0000000 | 4.000000 | 4.348736 | 2.958856 | 3.011095 |
| 201912 | 2.527644 | 2.537525 | 1.0190988 | 1.0000000 | 4.500498 | 4.906164 | 2.998355 | 3.033857 |
| 202001 | 2.495654 | 2.537525 | 1.0754316 | 1.0000000 | 4.319292 | 4.642408 | 2.978672 | 3.074896 |
| 202002 | 2.537525 | 2.588671 | 1.1703846 | 1.0000000 | 4.068836 | 4.381966 | 2.968435 | 3.148808 |
| 202003 | 2.537525 | 2.399339 | 0.2304544 | 0.5961290 | 5.310169 | 5.011864 | 2.976225 | 3.006708 |
| 202004 | 2.623311 | 2.623311 | 0.0000000 | 1.0000000 | 6.000000 | 5.657888 | 3.015135 | 3.149133 |
| 202005 | 3.000000 | 2.610335 | 0.4530818 | 0.6104578 | 6.414917 | 5.730984 | 4.064553 | 3.322808 |
| 202006 | 2.681402 | 2.473736 | 0.7317622 | 0.9928851 | 5.688994 | 5.086316 | 3.411253 | 3.065711 |
| 202007 | 2.887446 | 2.731703 | 0.8862122 | 1.0000000 | 6.000000 | 5.500000 | 3.144694 | 3.259721 |
| 202008 | 3.000000 | 2.980844 | 1.0000000 | 1.0000000 | 6.000000 | 5.760430 | 3.803460 | 3.180833 |
| 202009 | 2.980844 | 2.742111 | 1.0000000 | 0.9135693 | 5.874006 | 5.344923 | 3.441661 | 3.251740 |
| 202010 | 2.836102 | 2.702108 | 1.0000000 | 1.0000000 | 6.000000 | 5.191454 | 3.416837 | 3.437079 |
| 202011 | 2.962508 | 2.819740 | 1.0000000 | 1.0000000 | 5.944291 | 5.774719 | 3.494121 | 3.376649 |
| 202012 | 3.000000 | 2.980844 | 1.2811244 | 1.0000000 | 6.000000 | 5.904644 | 4.307177 | 3.199938 |
| 202101 | 3.046670 | 3.028186 | 1.5581499 | 1.1878090 | 6.754469 | 6.000000 | 4.548024 | 4.016052 |
| 202102 | 3.090884 | 3.000000 | 1.5469180 | 1.1869305 | 6.146096 | 6.000000 | 4.578317 | 4.374958 |
| 202103 | 3.244256 | 3.092952 | 1.8534898 | 1.4624749 | 6.280352 | 6.297847 | 4.920812 | 4.674566 |
| 202104 | 3.360180 | 3.098045 | 1.9892329 | 1.4624749 | 6.235626 | 6.310134 | 4.620441 | 4.307381 |
| 202105 | 4.000000 | 3.569710 | 2.3525007 | 1.8115404 | 8.200266 | 6.645209 | 5.261723 | 4.963713 |
| 202106 | 4.801745 | 3.546918 | 2.4637444 | 1.3498780 | 8.529976 | 6.973494 | 5.481582 | 4.751600 |
| 202107 | 4.842451 | 3.711669 | 2.5060110 | 1.5811223 | 8.452378 | 8.000000 | 5.410090 | 4.857979 |
| 202108 | 5.179827 | 3.999662 | 2.7170422 | 1.3798504 | 8.729171 | 7.763283 | 5.816178 | 4.947668 |
| 202109 | 5.310169 | 4.193985 | 2.6700342 | 1.7182721 | 8.713920 | 7.656233 | 5.522046 | 4.965563 |
| 202110 | 5.653467 | 4.211177 | 2.6414132 | 1.4647722 | 9.265794 | 8.385000 | 6.816117 | 5.031971 |
| 202111 | 6.000000 | 4.011200 | 3.0154593 | 1.0130244 | 9.733616 | 8.000000 | 7.233366 | 5.177737 |
| 202112 | 5.990274 | 4.000000 | 3.0000000 | 1.0285025 | 9.283830 | 7.785626 | 7.025210 | 4.854648 |
| 202201 | 5.788440 | 3.477248 | 2.6233110 | 0.1733402 | 9.298556 | 6.793561 | 7.118849 | 4.476177 |
| 202202 | 6.000000 | 3.774802 | 3.0095823 | 0.5622389 | 9.661465 | 7.141932 | 7.452888 | 4.724739 |
Now let me format the dates properly to treat these data as a time series.
Inflation.Expectations %<>%
  rename(date = 1) %>%
  mutate(date = yearmonth(parse_date_time(date, orders = "%Y%m")))
That’s pretty much all that is required to visualize them. Let’s have a look. I will use the fpp3 library and autoplot().
library(fpp3)## ── Attaching packages ──────────────────────────────────────────── fpp3 0.4.0 ──## ✓ tsibbledata 0.3.0 ✓ fable 0.3.1
## ✓ feasts 0.2.2## ── Conflicts ───────────────────────────────────────────────── fpp3_conflicts ──
## x lubridate::date() masks base::date()
## x magrittr::extract() masks tidyr::extract()
## x dplyr::filter() masks stats::filter()
## x kableExtra::group_rows() masks dplyr::group_rows()
## x tsibble::intersect() masks base::intersect()
## x tsibble::interval() masks lubridate::interval()
## x dplyr::lag() masks stats::lag()
## x magrittr::set_names() masks purrr::set_names()
## x tsibble::setdiff() masks base::setdiff()
## x tsibble::union() masks base::union()Inflation.Expectations %>%
as_tsibble(index=date) %>%
autoplot(`Median three-year ahead expected inflation rate`) +
geom_line(aes(y=Inflation.Expectations$`Median one-year ahead expected inflation rate`, color="red")) +
hrbrthemes::theme_ipsum() + guides(color = "none")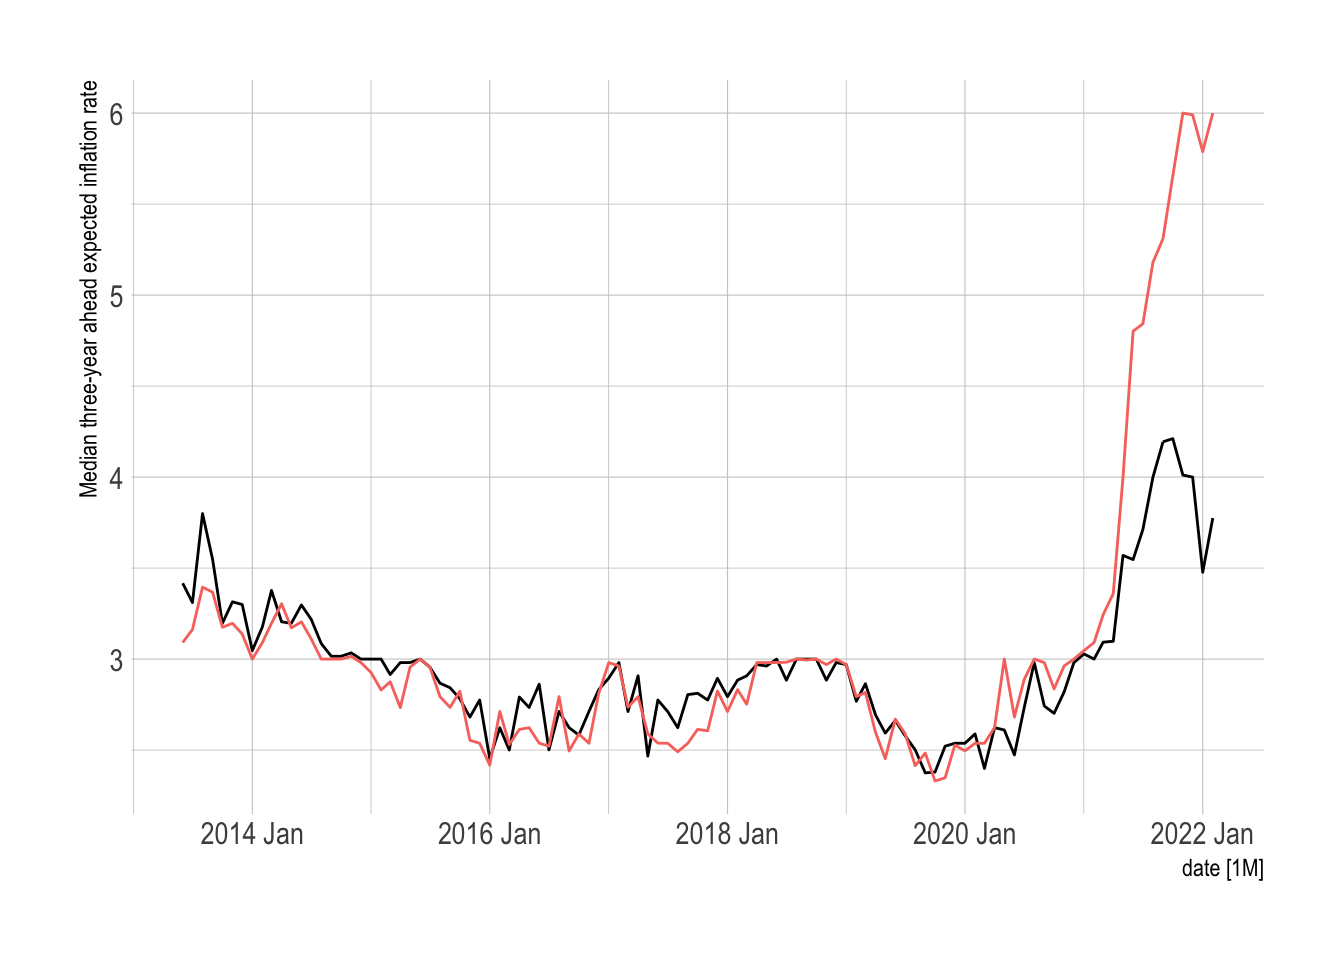
Now let me pretty the plot.
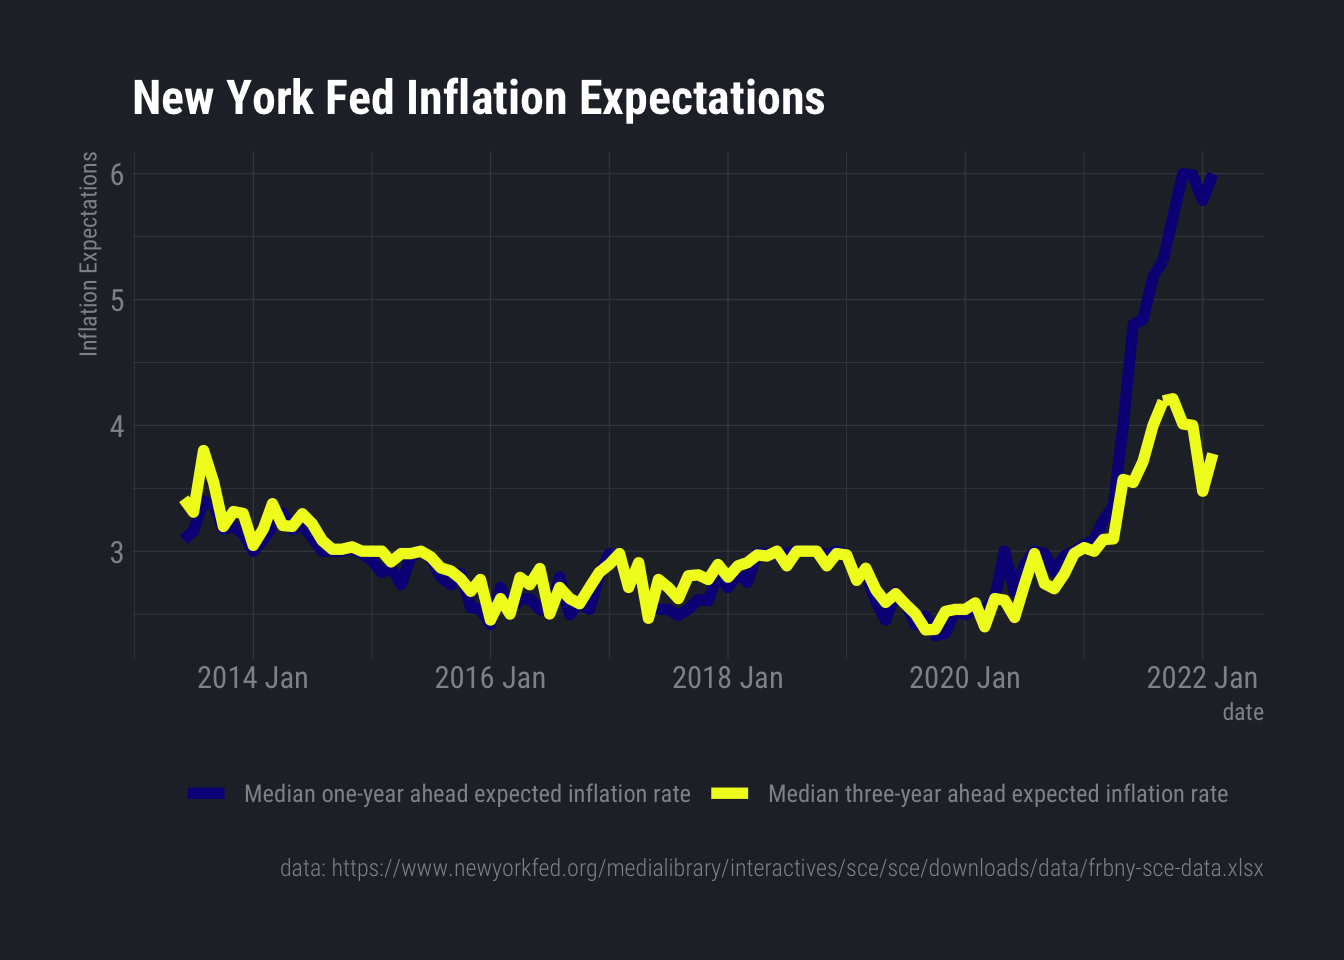
Inflation.Expectations %>%
  select(1:3) %>%
  pivot_longer(c(2:3)) %>%
  mutate(Variable = name) %>%
  ggplot(aes(x=date, y=value, color=Variable)) +
  geom_line(size=2) +
  scale_color_viridis_d(option="C") +
  hrbrthemes::theme_ft_rc() +
  theme(legend.position = "bottom") +
  labs(y="Inflation Expectations",
       color="",
       title="New York Fed Inflation Expectations",
       caption = "data: https://www.newyorkfed.org/medialibrary/interactives/sce/sce/downloads/data/frbny-sce-data.xlsx")