Cocktails
This week’s tidyTuesday contains data on cocktails with data from cocktail recipes drawn from two sources. Because one of the datasets comes from Mr. Boston, it is not exactly neutral with respect to alcohols and I am not a particular fan of gin. That said, the data should provide an interesting playground for looking at some frequencies and learning some things about cocktail recipes and ingredients. With that in mind, let turn to the data.
The Data
cocktails <- readr::read_csv('https://raw.githubusercontent.com/rfordatascience/tidytuesday/master/data/2020/2020-05-26/cocktails.csv')##
## ── Column specification ────────────────────────────────────────────────────────
## cols(
## row_id = col_double(),
## drink = col_character(),
## date_modified = col_datetime(format = ""),
## id_drink = col_double(),
## alcoholic = col_character(),
## category = col_character(),
## drink_thumb = col_character(),
## glass = col_character(),
## iba = col_character(),
## video = col_logical(),
## ingredient_number = col_double(),
## ingredient = col_character(),
## measure = col_character()
## )boston_cocktails <- readr::read_csv('https://raw.githubusercontent.com/rfordatascience/tidytuesday/master/data/2020/2020-05-26/boston_cocktails.csv')##
## ── Column specification ────────────────────────────────────────────────────────
## cols(
## name = col_character(),
## category = col_character(),
## row_id = col_double(),
## ingredient_number = col_double(),
## ingredient = col_character(),
## measure = col_character()
## )boston_cocktails %>%
group_by(name) %>%
summarise(Ingredients = n()) %>%
ggplot(., aes(x=Ingredients)) +
geom_histogram(bins = 24, fill="blue") +
theme_economist_white() +
labs(title="How Many Ingredients in a Mr. Boston Drink Recipe?",
caption="#tidyTuesday by @PieRatio")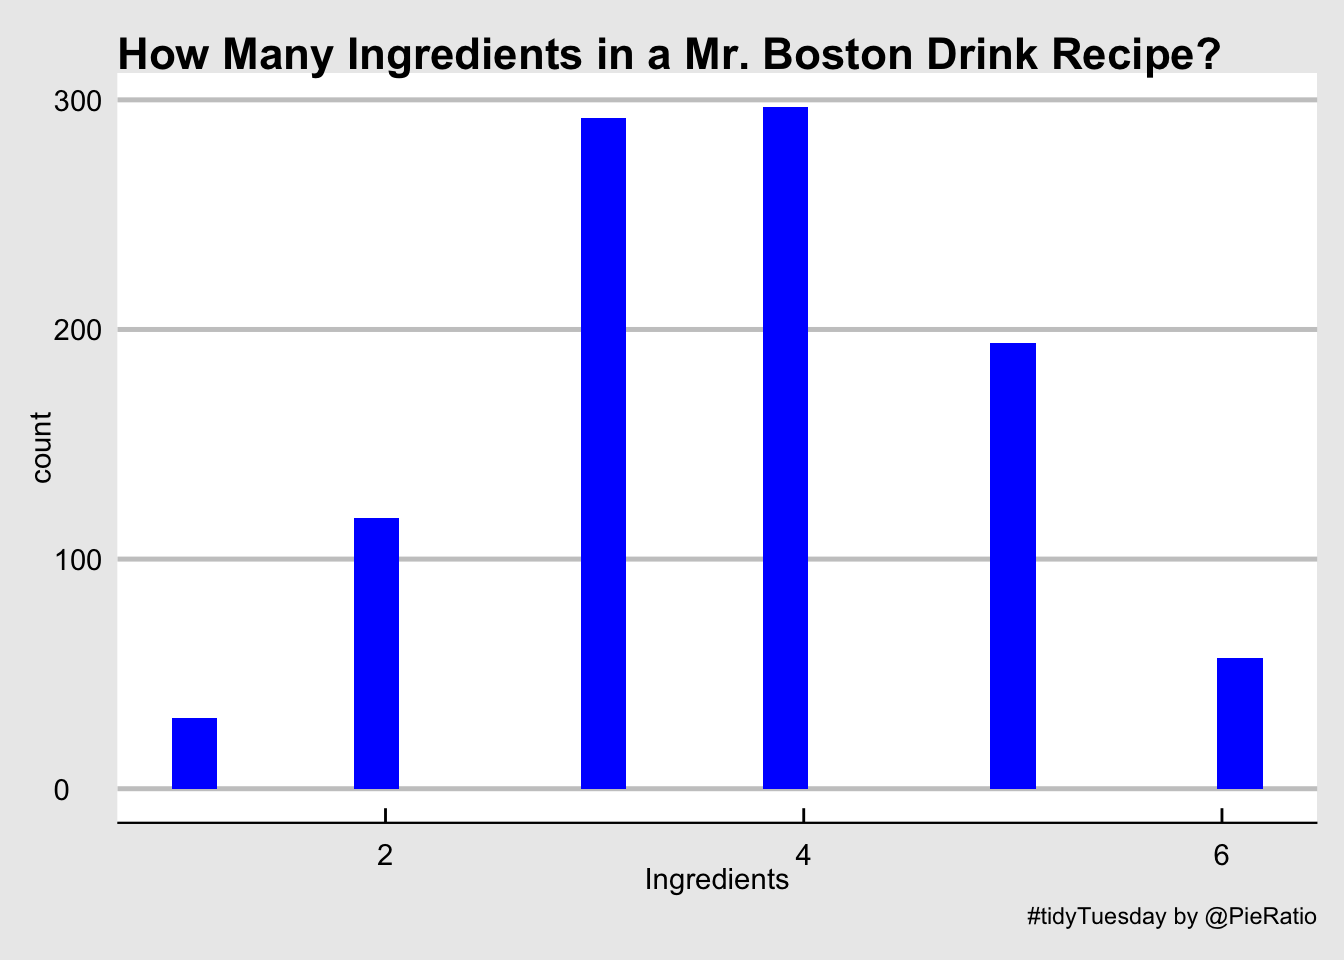
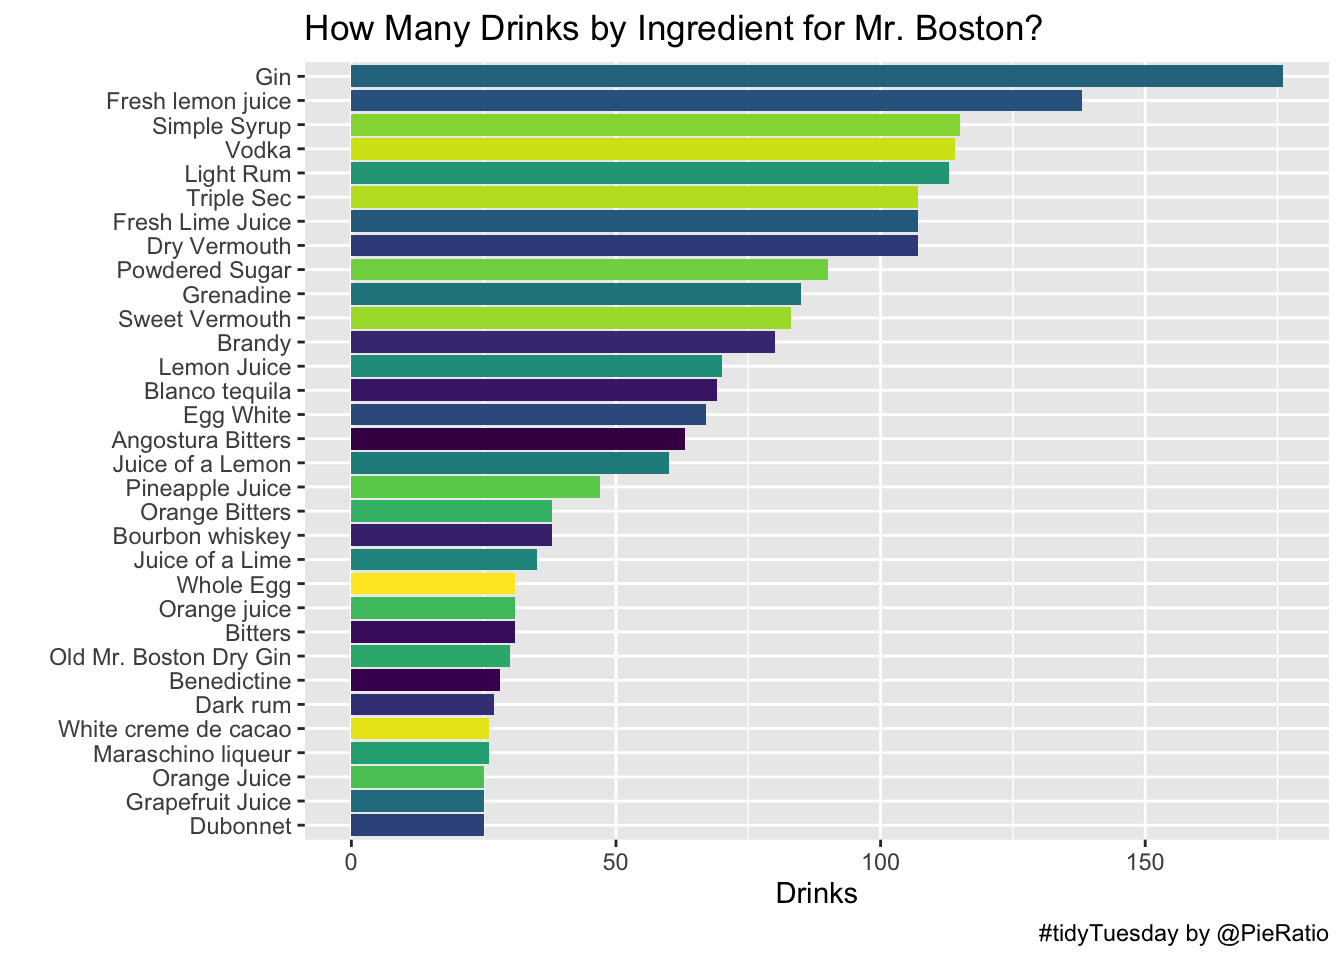
boston_cocktails %>%
  group_by(ingredient) %>%
  summarise(Drinks = n()) %>%
  top_n(30) %>%
  ggplot(., aes(x=forcats::fct_reorder(ingredient, Drinks), y=Drinks, fill=ingredient)) + geom_col() +
  coord_flip() +
  labs(title="How Many Drinks by Ingredient for Mr. Boston?",
       caption="#tidyTuesday by @PieRatio", x="") +
  scale_fill_viridis_d() +
  guides(fill=FALSE)
## Selecting by Drinks