Global mortality tidyTuesday
tidyTuesday on Global Mortality
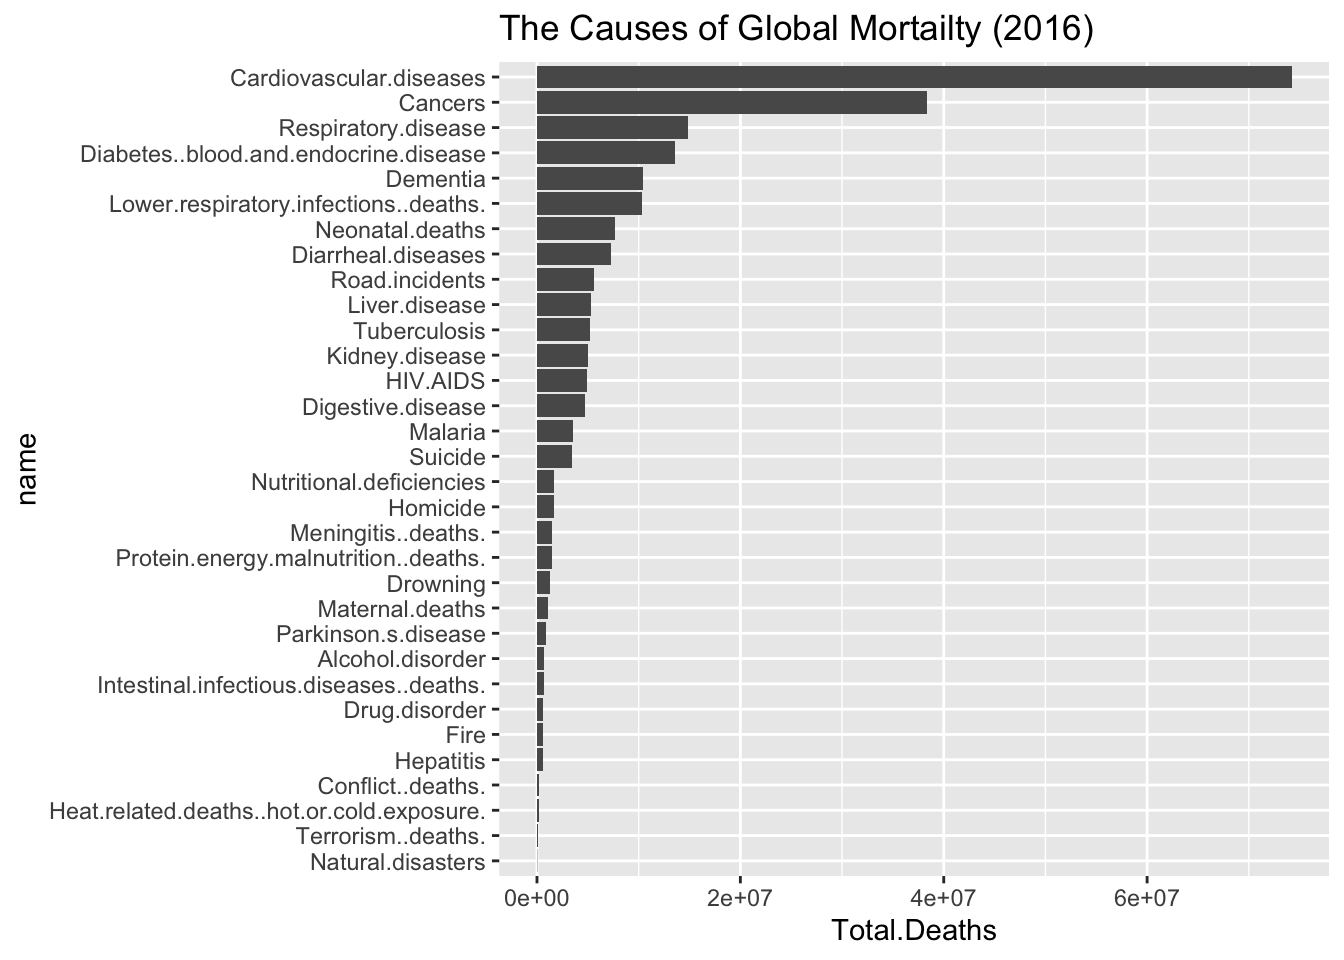
The three generic challenge graphics involve two global summaries, a raw count by type and a percentage by type. The individual county breakdowns are recorded for a predetermined year below. This can all be seen in the original. For whatever reason, I cannot open this data remotely.
Here is this week’s tidyTuesday.
library(skimr)
library(tidyverse)
library(rlang)
# global_mortality <- readRDS("../../data/global_mortality.rds")
global_mortality <- readRDS(url("https://github.com/robertwwalker/academic-mymod/raw/master/data/global_mortality.rds"))
skim(global_mortality)| Name | global_mortality |
| Number of rows | 6156 |
| Number of columns | 35 |
| _______________________ | |
| Column type frequency: | |
| character | 2 |
| numeric | 33 |
| ________________________ | |
| Group variables | None |
Variable type: character
| skim_variable | n_missing | complete_rate | min | max | empty | n_unique | whitespace |
|---|---|---|---|---|---|---|---|
| country | 0 | 1.00 | 4 | 32 | 0 | 228 | 0 |
| country_code | 864 | 0.86 | 3 | 8 | 0 | 196 | 0 |
Variable type: numeric
| skim_variable | n_missing | complete_rate | mean | sd | p0 | p25 | p50 | p75 | p100 | hist |
|---|---|---|---|---|---|---|---|---|---|---|
| year | 0 | 1.00 | 2003.00 | 7.79 | 1990.00 | 1996.00 | 2003.00 | 2010.00 | 2016.00 | ▇▇▇▇▇ |
| Cardiovascular diseases (%) | 0 | 1.00 | 29.93 | 14.02 | 1.43 | 18.74 | 30.65 | 38.45 | 67.39 | ▃▅▇▂▁ |
| Cancers (%) | 0 | 1.00 | 14.39 | 8.15 | 0.58 | 6.93 | 13.31 | 21.36 | 33.62 | ▇▇▆▆▃ |
| Respiratory diseases (%) | 0 | 1.00 | 4.10 | 2.35 | 0.30 | 2.26 | 3.63 | 5.38 | 16.29 | ▇▇▂▁▁ |
| Diabetes (%) | 0 | 1.00 | 6.29 | 4.44 | 0.33 | 3.20 | 4.99 | 7.93 | 35.82 | ▇▂▁▁▁ |
| Dementia (%) | 0 | 1.00 | 3.22 | 2.75 | 0.04 | 1.01 | 2.53 | 4.33 | 16.67 | ▇▃▁▁▁ |
| Lower respiratory infections (%) | 0 | 1.00 | 5.84 | 3.42 | 0.68 | 3.21 | 5.14 | 8.16 | 20.04 | ▇▆▃▁▁ |
| Neonatal deaths (%) | 0 | 1.00 | 4.57 | 3.85 | 0.04 | 0.69 | 3.89 | 7.74 | 17.81 | ▇▃▃▁▁ |
| Diarrheal diseases (%) | 0 | 1.00 | 3.20 | 4.36 | 0.01 | 0.18 | 0.77 | 5.29 | 25.18 | ▇▂▁▁▁ |
| Road accidents (%) | 0 | 1.00 | 2.53 | 2.19 | 0.28 | 1.36 | 1.93 | 2.90 | 20.90 | ▇▁▁▁▁ |
| Liver disease (%) | 0 | 1.00 | 2.12 | 1.24 | 0.19 | 1.34 | 1.83 | 2.54 | 11.65 | ▇▂▁▁▁ |
| Tuberculosis (%) | 0 | 1.00 | 2.13 | 2.65 | 0.01 | 0.24 | 0.91 | 3.33 | 16.47 | ▇▂▁▁▁ |
| Kidney disease (%) | 0 | 1.00 | 2.09 | 1.49 | 0.06 | 0.90 | 1.73 | 2.96 | 9.95 | ▇▅▂▁▁ |
| Digestive diseases (%) | 0 | 1.00 | 1.97 | 0.68 | 0.31 | 1.51 | 1.93 | 2.29 | 5.16 | ▂▇▃▁▁ |
| HIV/AIDS (%) | 0 | 1.00 | 3.35 | 7.81 | 0.00 | 0.08 | 0.44 | 2.33 | 62.19 | ▇▁▁▁▁ |
| Suicide (%) | 0 | 1.00 | 1.39 | 1.11 | 0.10 | 0.69 | 1.18 | 1.80 | 15.41 | ▇▁▁▁▁ |
| Malaria (%) | 0 | 1.00 | 1.80 | 4.21 | 0.00 | 0.00 | 0.00 | 0.48 | 24.43 | ▇▁▁▁▁ |
| Homicide (%) | 0 | 1.00 | 0.98 | 1.45 | 0.05 | 0.24 | 0.52 | 1.00 | 14.23 | ▇▁▁▁▁ |
| Nutritional deficiencies (%) | 0 | 1.00 | 1.10 | 1.87 | 0.00 | 0.09 | 0.40 | 1.34 | 35.55 | ▇▁▁▁▁ |
| Meningitis (%) | 0 | 1.00 | 0.78 | 0.97 | 0.03 | 0.11 | 0.35 | 1.02 | 6.98 | ▇▂▁▁▁ |
| Protein-energy malnutrition (%) | 0 | 1.00 | 1.00 | 1.81 | 0.00 | 0.06 | 0.32 | 1.22 | 35.52 | ▇▁▁▁▁ |
| Drowning (%) | 0 | 1.00 | 0.71 | 0.51 | 0.05 | 0.35 | 0.61 | 0.96 | 4.51 | ▇▂▁▁▁ |
| Maternal deaths (%) | 0 | 1.00 | 0.59 | 0.70 | 0.00 | 0.03 | 0.24 | 1.00 | 3.41 | ▇▂▂▁▁ |
| Parkinson disease (%) | 0 | 1.00 | 0.29 | 0.26 | 0.00 | 0.07 | 0.21 | 0.43 | 1.59 | ▇▃▁▁▁ |
| Alcohol disorders (%) | 0 | 1.00 | 0.32 | 0.41 | 0.01 | 0.08 | 0.16 | 0.39 | 3.08 | ▇▁▁▁▁ |
| Intestinal infectious diseases (%) | 0 | 1.00 | 0.18 | 0.30 | 0.00 | 0.00 | 0.01 | 0.27 | 2.28 | ▇▁▁▁▁ |
| Drug disorders (%) | 0 | 1.00 | 0.18 | 0.19 | 0.00 | 0.06 | 0.12 | 0.23 | 1.31 | ▇▂▁▁▁ |
| Hepatitis (%) | 0 | 1.00 | 0.16 | 0.17 | 0.00 | 0.04 | 0.11 | 0.24 | 1.58 | ▇▁▁▁▁ |
| Fire (%) | 0 | 1.00 | 0.33 | 0.18 | 0.06 | 0.19 | 0.32 | 0.43 | 1.34 | ▇▇▁▁▁ |
| Heat-related (hot and cold exposure) (%) | 0 | 1.00 | 0.10 | 0.13 | 0.01 | 0.04 | 0.07 | 0.11 | 1.17 | ▇▁▁▁▁ |
| Natural disasters (%) | 0 | 1.00 | 0.09 | 1.28 | 0.00 | 0.00 | 0.00 | 0.02 | 65.29 | ▇▁▁▁▁ |
| Conflict (%) | 1398 | 0.77 | 0.29 | 2.40 | 0.00 | 0.00 | 0.00 | 0.02 | 82.32 | ▇▁▁▁▁ |
| Terrorism (%) | 1398 | 0.77 | 0.04 | 0.23 | 0.00 | 0.00 | 0.00 | 0.00 | 5.88 | ▇▁▁▁▁ |
That loads the data for the challenge.
Counts <- read.csv(url("https://github.com/robertwwalker/academic-mymod/raw/master/data/annual-number-of-deaths-by-cause.csv"))
Counts %>% filter(Year==2016) %>% select(-Code,-Entity,-Execution..deaths.,-Year) %>% apply(., 2, function(x) { sum(x, na.rm=TRUE)}) -> temp1
pp.df <- data.frame(Total.Deaths=temp1,name=names(temp1))
pp.df <- pp.df %>% arrange(Total.Deaths)
pp.df$name <- factor(pp.df$name, levels = pp.df$name)
cplot <- ggplot(pp.df, aes(name,Total.Deaths)) + geom_bar(stat="identity") + coord_flip() + scale_fill_gradientn(colours = terrain.colors(10)) + ggtitle("The Causes of Global Mortailty (2016)")
cplot
With a reenactment of the base target plots, I can turn to new visuals. I wanted to be able to develop a comparison of the various classified causes of death and to try out my nifty function for summarizing panel data. So here goes.
xtsum <- function(formula, data) {
  pform <- terms(formula, data=data)
  unit <- pform[[2]]
  vars <- attr(pform, "term.labels")
  cls <- sapply(data, class)
  data <- data %>% select(which(cls%in%c("numeric","integer")))
  varnames <- intersect(names(data),vars)
  sumfunc <- function(data=data, varname, unit) {
  loc.unit <- enquo(unit)
  varname <- ensym(varname)
    ores <- data %>% filter(!is.na(!! varname)==TRUE) %>% summarise(
    O.mean=round(mean(`$`(data, !! varname), na.rm=TRUE), digits=3),
    O.sd=round(sd(`$`(data, !! varname), na.rm=TRUE), digits=3),
    O.min = min(`$`(data, !! varname), na.rm=TRUE),
    O.max=max(`$`(data, !! varname), na.rm=TRUE),
    O.SumSQ=round(sum(scale(`$`(data, !! varname), center=TRUE, scale=FALSE)^2, na.rm=TRUE), digits=3),
    O.N=sum(as.numeric((!is.na(`$`(data, !! varname))))))
 bmeans <- data %>% filter(!is.na(!! varname)==TRUE) %>% group_by(!! loc.unit) %>% summarise(
   meanx=mean(`$`(.data, !! varname), na.rm=T),
   t.count=sum(as.numeric(!is.na(`$`(.data, !! varname)))))
    bres <- bmeans %>% ungroup() %>% summarise(
    B.mean = round(mean(meanx, na.rm=TRUE), digits=3),
    B.sd = round(sd(meanx, na.rm=TRUE), digits=3),
    B.min = min(meanx, na.rm=TRUE),
    B.max=max(meanx, na.rm=TRUE),
    Units=sum(as.numeric(!is.na(t.count))),
    t.bar=round(mean(t.count, na.rm=TRUE), digits=3))
  wdat <- data %>% filter(!is.na(!! varname)==TRUE) %>% group_by(!! loc.unit) %>% mutate(
    W.x = scale(`$`(.data,!! varname), scale=FALSE))
  wres <- wdat %>% ungroup() %>% summarise(
    W.sd=round(sd(W.x, na.rm=TRUE), digits=3),
    W.min=min(W.x, na.rm=TRUE),
    W.max=max(W.x, na.rm=TRUE),
    W.SumSQ=round(sum(W.x^2, na.rm=TRUE), digits=3))
    W.Ratio <- round(wres$W.SumSQ/ores$O.SumSQ, digits=3)
  return(c(ores,bres,wres,Within.Ovr.Ratio=W.Ratio))
  }
res1 <- sapply(varnames, function(x) {sumfunc(data, !!x, !!unit)})
return(t(res1))
}
global_mortality$countryF <- as.factor(global_mortality$country)
global_mortality$countryN <- as.numeric(as.factor(global_mortality$country))
names(global_mortality) <- gsub(" \\(%\\)","",names(global_mortality))
# For some reason, the xtsum function does not respond to the weird variable names but will accept them devoid of (%)
myxt.res <- xtsum(countryN~., data=global_mortality)
myxt.res
## O.mean O.sd O.min O.max O.SumSQ O.N B.mean B.sd
## year 2003 7.79 1990 2016 373464 6156 2003 0
## Cancers 14.387 8.154 0.5822726 33.6175 409267.1 6156 14.387 8.034
## Diabetes 6.286 4.436 0.3271329 35.81619 121099.2 6156 6.286 4.24
## Dementia 3.221 2.746 0.04475178 16.67248 46417.87 6156 3.221 2.618
## Tuberculosis 2.133 2.648 0.01088091 16.46586 43159.87 6156 2.133 2.554
## Suicide 1.391 1.111 0.1016103 15.41202 7591.252 6156 1.391 1.086
## Malaria 1.801 4.213 0 24.42596 109251.4 6156 1.801 4.11
## Homicide 0.983 1.454 0.04520209 14.22926 13007.95 6156 0.983 1.425
## Meningitis 0.783 0.967 0.02798604 6.981346 5760.664 6156 0.783 0.951
## Drowning 0.714 0.514 0.05330638 4.510948 1628.778 6156 0.714 0.487
## Hepatitis 0.161 0.165 0.004847886 1.583289 167.675 6156 0.161 0.158
## Fire 0.334 0.181 0.05691324 1.343686 201.769 6156 0.334 0.168
## Conflict 0.291 2.399 0 82.317 27372.61 4758 0.291 0.921
## Terrorism 0.037 0.229 0 5.877 250.161 4758 0.037 0.121
## B.min B.max Units t.bar W.sd W.min W.max
## year 2003 2003 228 27 7.79 -13 13
## Cancers 3.109526 30.19716 228 27 1.489 -8.017757 5.449552
## Diabetes 1.183787 27.70547 228 27 1.331 -9.750057 10.92867
## Dementia 0.2734327 11.82133 228 27 0.847 -5.183193 5.145011
## Tuberculosis 0.03205589 14.84698 228 27 0.72 -6.169898 7.156982
## Suicide 0.2441106 12.16457 228 27 0.243 -2.210464 3.247445
## Malaria 0 20.10408 228 27 0.963 -7.916651 6.903596
## Homicide 0.05593046 11.06133 228 27 0.303 -3.487857 3.167933
## Meningitis 0.04221932 5.315156 228 27 0.187 -1.984723 2.166714
## Drowning 0.06142987 3.515331 228 27 0.168 -1.775808 1.274717
## Hepatitis 0.008156611 0.9932521 228 27 0.048 -0.3946904 0.8763799
## Fire 0.07003296 0.9950066 228 27 0.069 -0.4329619 0.8721761
## Conflict 0 9.320885 183 26 2.216 -9.320885 78.38404
## Terrorism 0 1.298962 183 26 0.195 -1.298962 4.578038
## W.SumSQ Within.Ovr.Ratio
## year 373464 1
## Cancers 13651.25 0.033
## Diabetes 10897.8 0.09
## Dementia 4420.371 0.095
## Tuberculosis 3193.133 0.074
## Suicide 364.808 0.048
## Malaria 5711.216 0.052
## Homicide 564.186 0.043
## Meningitis 216.175 0.038
## Drowning 174.405 0.107
## Hepatitis 14.147 0.084
## Fire 29.045 0.144
## Conflict 23357.85 0.853
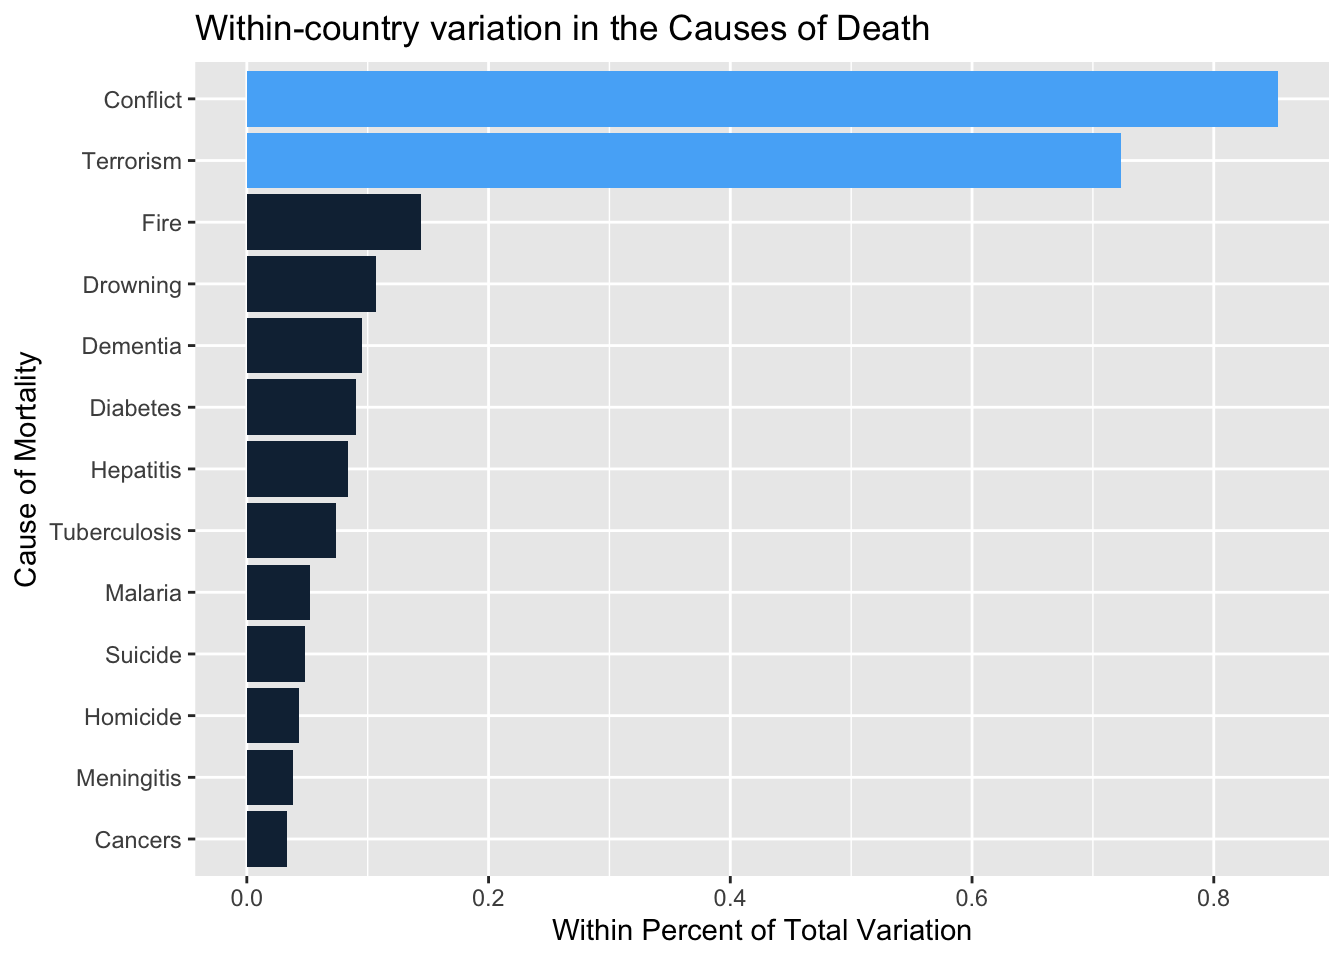
## Terrorism 180.881 0.723The function output can be read as follows. It needs better formatting as a table. For now, O. is an overall measure, overall mean, standard deviation, minimum, maximum, sum of squares and total observations. A between mean, standard deviation, minimum, and maximum with the number of units and the average number of time points. Finally, we have a within standard deviation, minimum, maximum, sum of squares, and a within proportion of the overall variance. In this case, terrorism and conflict are the two variables that vary almost entirely within and far less between countries. I suspect this is because they are rather high in a few places and consistently so.
ggplot.res <- data.frame(myxt.res)
ggplot.res <- ggplot.res[-1,]; ggplot.res <- ggplot.res[,17]
mydf <- t(data.frame(ggplot.res))
mydf <- data.frame(value=mydf,name=rownames(mydf))
mydf <- mydf %>% arrange(value)
mydf$name <- factor(mydf$name, levels = mydf$name)
mydf <- mydf %>% mutate(Emph=as.numeric(value>0.5))
mydf %>% ggplot(aes(name,value, fill=Emph)) + geom_bar(stat="identity") + coord_flip() + ylab("Within Percent of Total Variation") + xlab("Cause of Mortality") + ggtitle("Within-country variation in the Causes of Death") + guides(fill="none")
Mean.Homicide <- global_mortality %>% group_by(countryF) %>% summarise(mymean=mean(Homicide, na.rm=TRUE))
Mean.Homicide %>% ungroup() %>% arrange(mymean) -> mydf
mydf$countryF <- factor(mydf$countryF, levels = mydf$countryF)
mydf %>% ungroup() %>% top_n(30, mymean) %>% arrange(mymean) %>% mutate(Emph=c(rep(1,10),rep(2,10),rep(3,10))) -> mydf
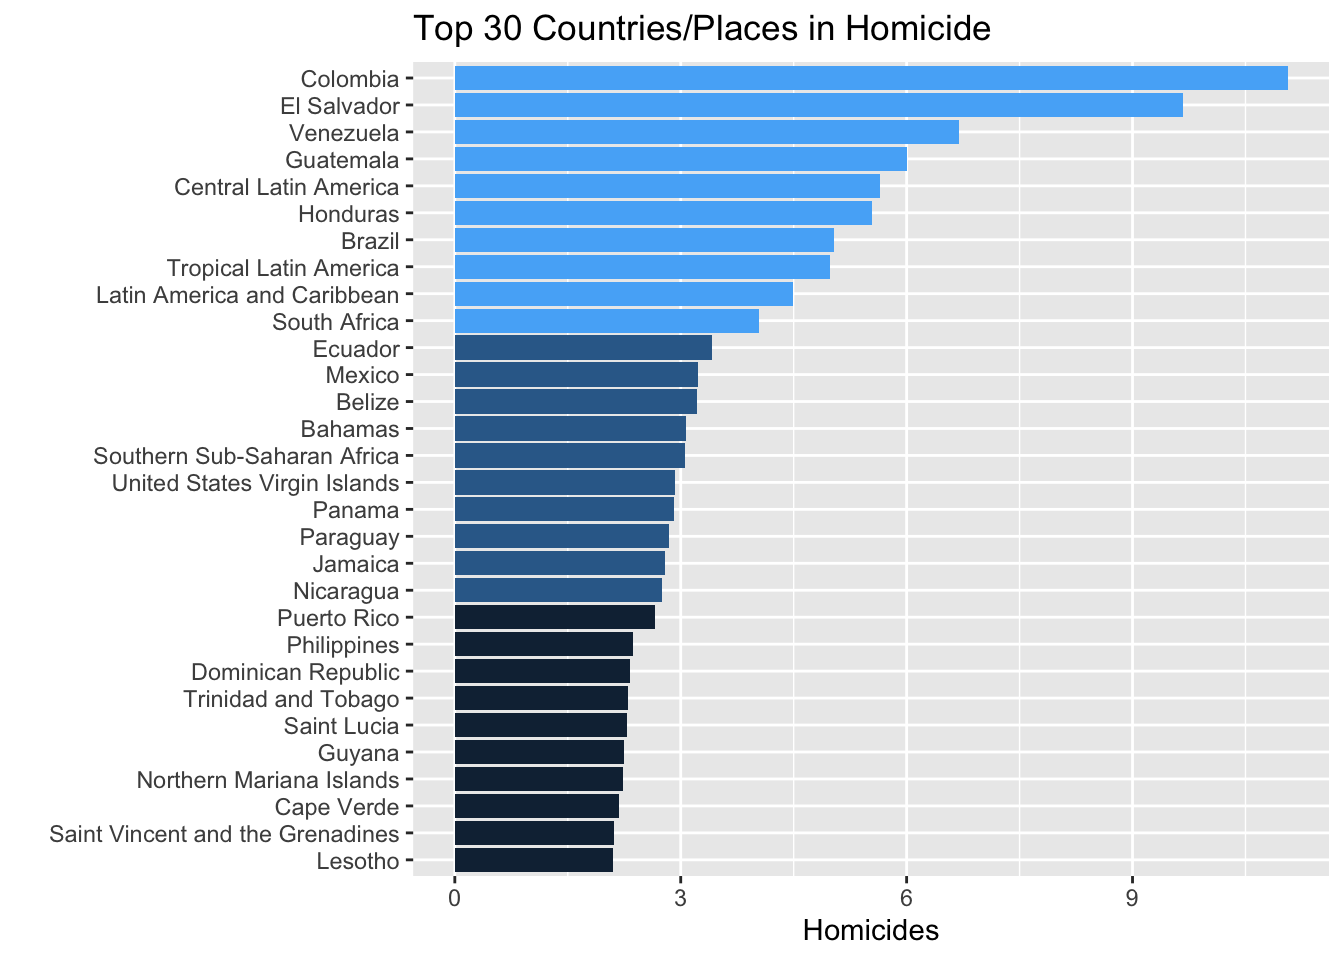
mydf %>% ggplot(aes(countryF,mymean, fill=Emph)) + geom_bar(stat="identity") + coord_flip() + ylab("Homicides") + ggtitle("Top 30 Countries/Places in Homicide") + xlab("") + guides(fill="none") -> Homicideplot
Homicideplot
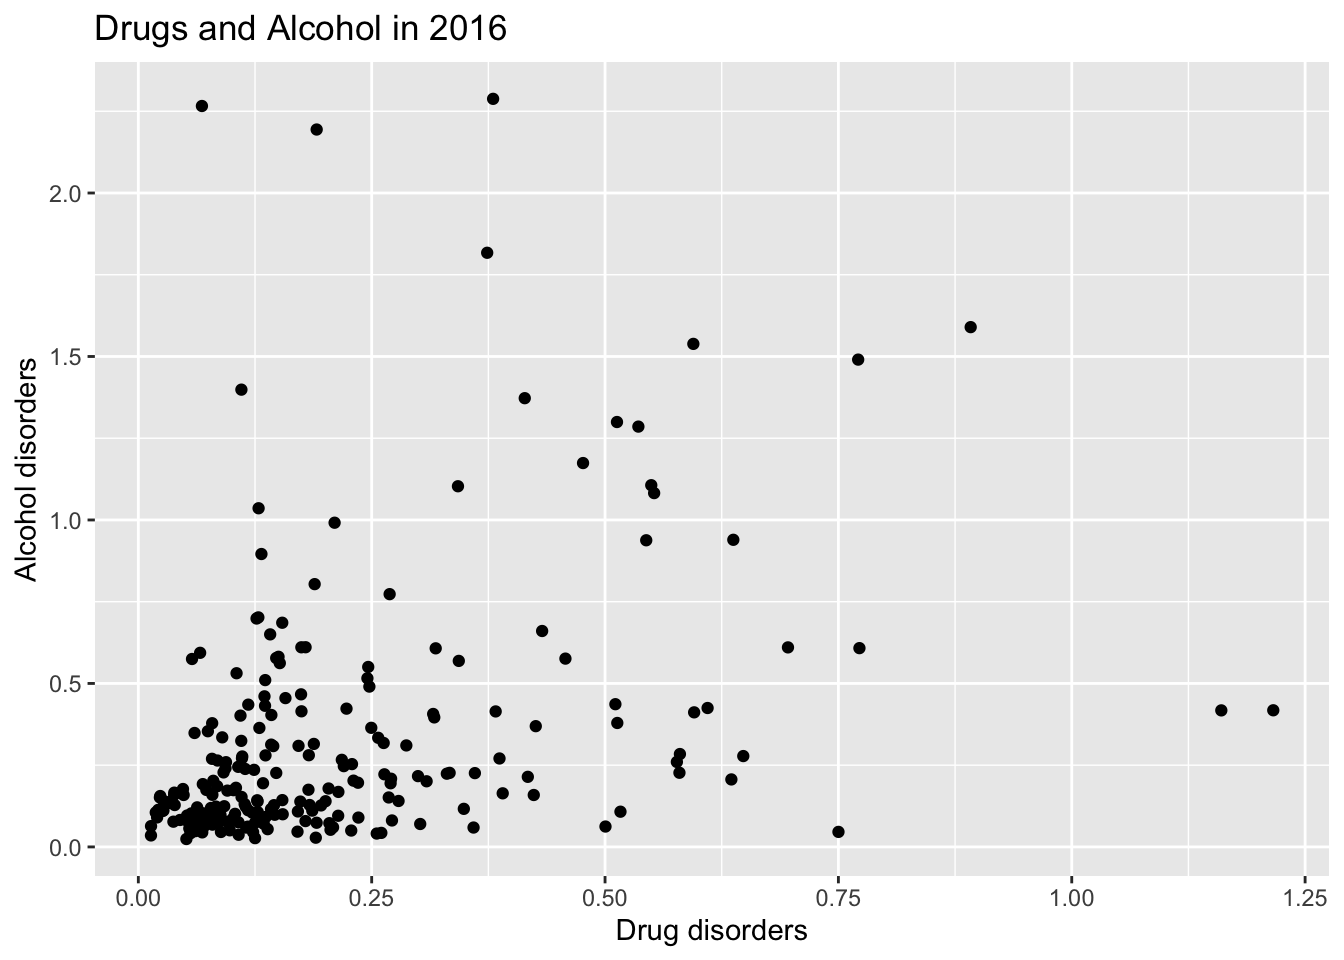
global_mortality %>% filter(year==2016) %>% ggplot(aes(`Drug disorders`,`Alcohol disorders`)) + geom_point() + ggtitle("Drugs and Alcohol in 2016") -> scatterDA
scatterDA